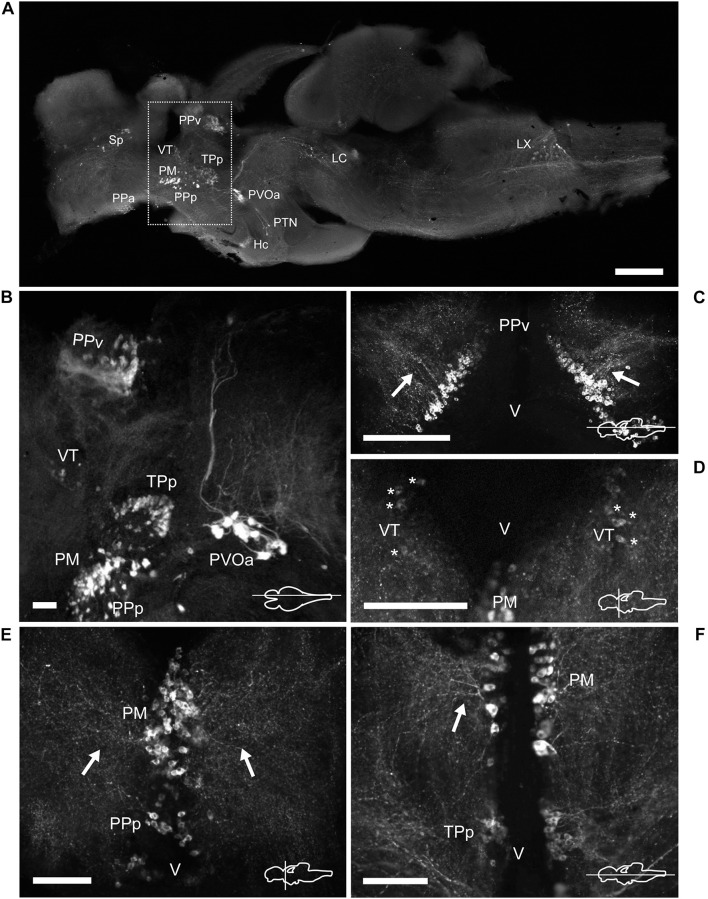
FIGURE 5.
TH immunoreactive neurons and fibers in the diencephalon of Nothobranchius furzeri at the preoptic, thalamic, and pretectal levels. (A) Para-sagittal section of the brain showing a panoramic distribution of TH+ groups. The dotted box delimits the neuronal groups analyzed in this figure. (B) Para-sagittal section showing the TH+ groups at the ventral periventricular pretectal nucleus, ventral thalamic nucleus, parvocellular portion of preoptic nucleus, magnocellular preoptic nucleus, and paraventricular organ-accompanying cells. (C) Horizontal section showing the densely packed TH+ neurons of the ventral periventricular pretectal nucleus sending projections toward to the optic tectum (arrows). (D) Transverse section showing TH+ neurons at the ventral thalamus with characteristic slightly stained somas (asterisks). (E) TH+ cells of the parvocellular portion of preoptic nucleus and the magnocellular preoptic nucleus with their lateral projections as seen in a transverse section (arrows). (F) Horizontal section showing TH+ neurons and their projections (arrow) at the magnocellular nucleus and its relative position with respect to the periventricular nucleus of the posterior tuberculum. For abbreviations see list. The orientation/level of sections is shown at the bottom right corner of each panel. Dorsal is to the top in transverse sections. Rostral is to the top and left in horizontal and para-sagittal sections, respectively. Scale bars, 500 μm (A) and 100 μm (B–F).

