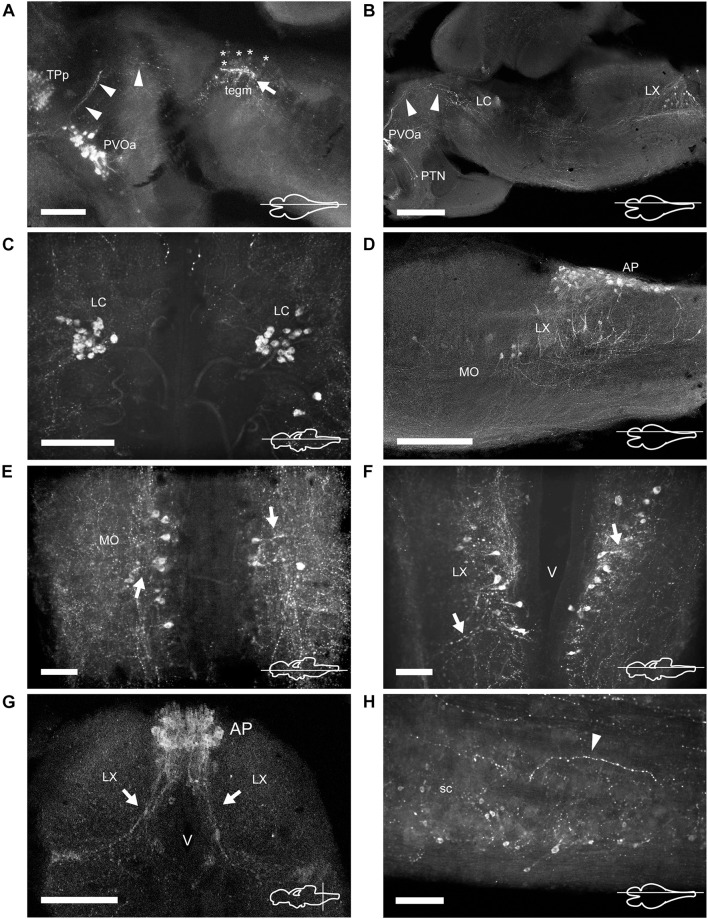
FIGURE 7.
TH immunoreactive neurons and fibers in the mesencephalon, rhombencephalon, and spinal cord of Nothobranchius furzeri. (A) Para-sagittal section showing the group of mesencephalic TH+ neurons at the level of the oculomotor nucleus (tegm; asterisks indicate their lightly stained somas) and the intense TH+ plexus (arrow). TH+ fibers traveling from the paraventricular organ-accompanying cells across the mesencephalon to turn posteriorly toward the medulla are indicated with arrowheads. (B) Para-sagittal section along the extension of the rhombencephalon showing the most rostral TH+ group at the locus coeruleus and the caudal group in the vagal lobe. Arrowheads point to the same TH+ projections as in (A). (C) Horizontal section showing the TH+ group of the locus coeruleus. (D) Para-sagittal section showing the distribution of caudal rhombencephalic TH+ groups (medulla oblongata, vagal lobe, and area postrema). (E,F) Horizontal sections showing the TH+ groups at the medulla oblongata and vagal lobe. Arrows indicate the lateral projections. (G) Transverse section showing the densely packed group of TH+ neurons at the area postrema. Arrows indicate the ventral processes. (H) Para-sagittal section showing scattered small TH+ neurons in the spinal cord. The arrowhead points to a TH+ fiber in the ventral region of the spinal cord. For abbreviations see list. The orientation/level of sections is shown at the bottom right corner of each panel. Dorsal is to the top in transverse sections. Rostral is to the top and left, in horizontal and para-sagittal sections, respectively. Scale bars, 500 μm (A,D), 250 μm (B,G), and 100 μm (C,E,F,H).

