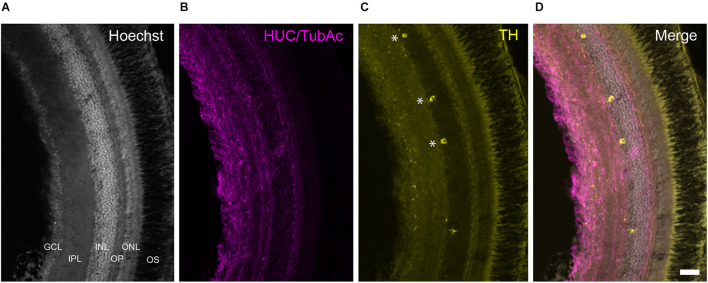
FIGURE 8.
TH+ cells in the retina of Nothobranchius furzeri. (A) Hoechst stain showing the basic organization of the retina into the ganglion cell layer, inner plexiform layer, inner nuclear layer, outer plexiform layer, outer nuclear layer, and outer segment. (B) HUC/TubAc immunohistochemistry (magenta) showing the spatial distribution of somas and axons within the retina layers. (C) TH immunohistochemistry (yellow). Asterisks indicate TH+ amacrine cells. (D) Merge of the staining in a-c showing the localization of TH+ cells in the inner nuclear layer. For abbreviations see list. Scale bar, 100 μm.

