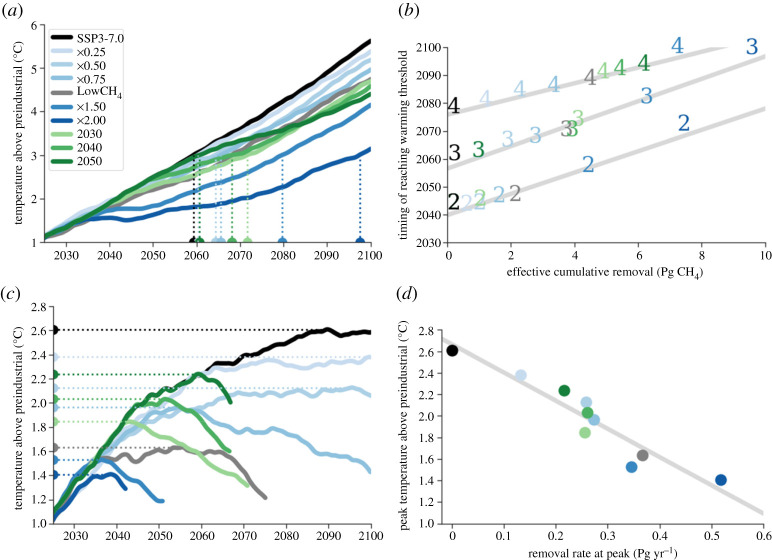
Figure 3.
(a, b) Effective cumulative methane removal causes a linear delay in reaching warming thresholds in SSP3-7.0. (c, d) Methane removal rate causes a linear reduction in peak temperature in SSP1-2.6. (a) SSP3-7.0 decadal average temperatures showing an example of the timing of reaching 3°C warming with dotted lines; (b) correlation between effective cumulative removal and timing of warming thresholds with lines of best fit in grey (calculated using linear least-squares regression). Numbers indicate the temperature (in°C) above preindustrial that has been reached; (c) decadal average temperatures for SSP1-2.6 scenarios showing peak temperatures with dotted lines; (d) correlation between removal rate and temperature at peak along with the best fit line in grey (calculated using linear least-squares regression). (Online version in colour.)

