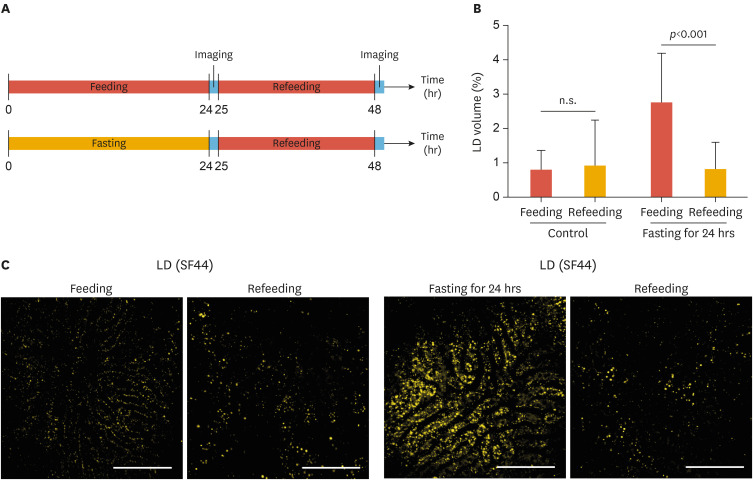
Fig. 3. Intravital imaging of resolution of accumulated hepatic LDs with refeeding after fasting. (A) Experimental scheme of the repeated intravital liver imaging of the same mice after fasting and refeeding. (B) Quantitative analysis of the volumetric LD ratio in the liver. (C) Representative images of hepatic LDs in the liver after normal feeding or fasting and refeeding. Data are presented as mean±standard deviation of mean. Scale bars, 100 µm.
LD, lipid droplet; SF44, Seoul-Flour 44.

