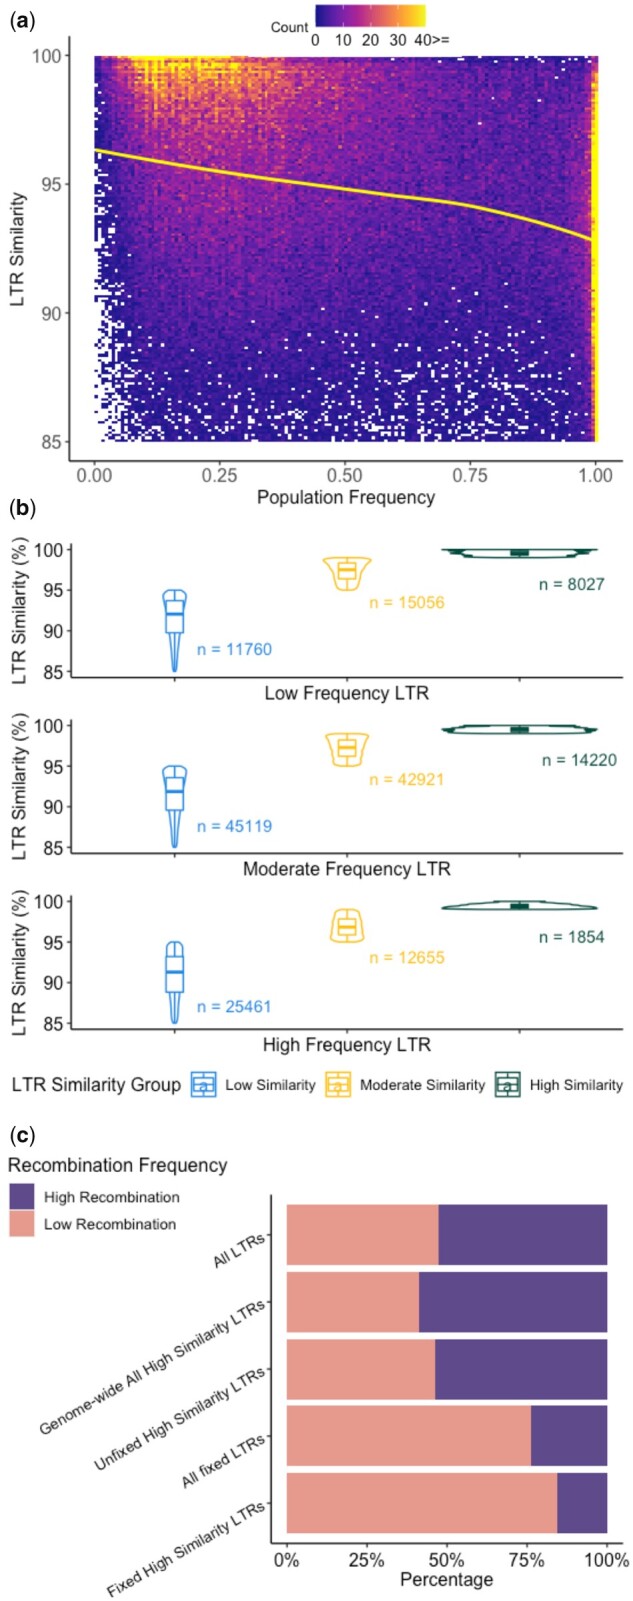
Figure 2.

Relationship between TE similarity and frequency in a population of diverse inbred lines. (A) Heatmap of LTR similarity vs frequency where white boxes indicate no TEs present at a particular frequency-by-LTR similarity. Yellow line is a LOESS curve fit through the data (n = 177,073). (B) Relationship of LTR similarity in categories of low similarity (LTR similarity <95%), moderate similarity (LTR similarity between 95 and 99%), and high similarity (LTR similarity >99%), and frequency in categories of low (<20%), moderate (20–80%), and high frequency (>80%). (C) Proportion of different groups of LTRs in the low and high recombination portions of the genome based on B73 reference (n = 108,968).
