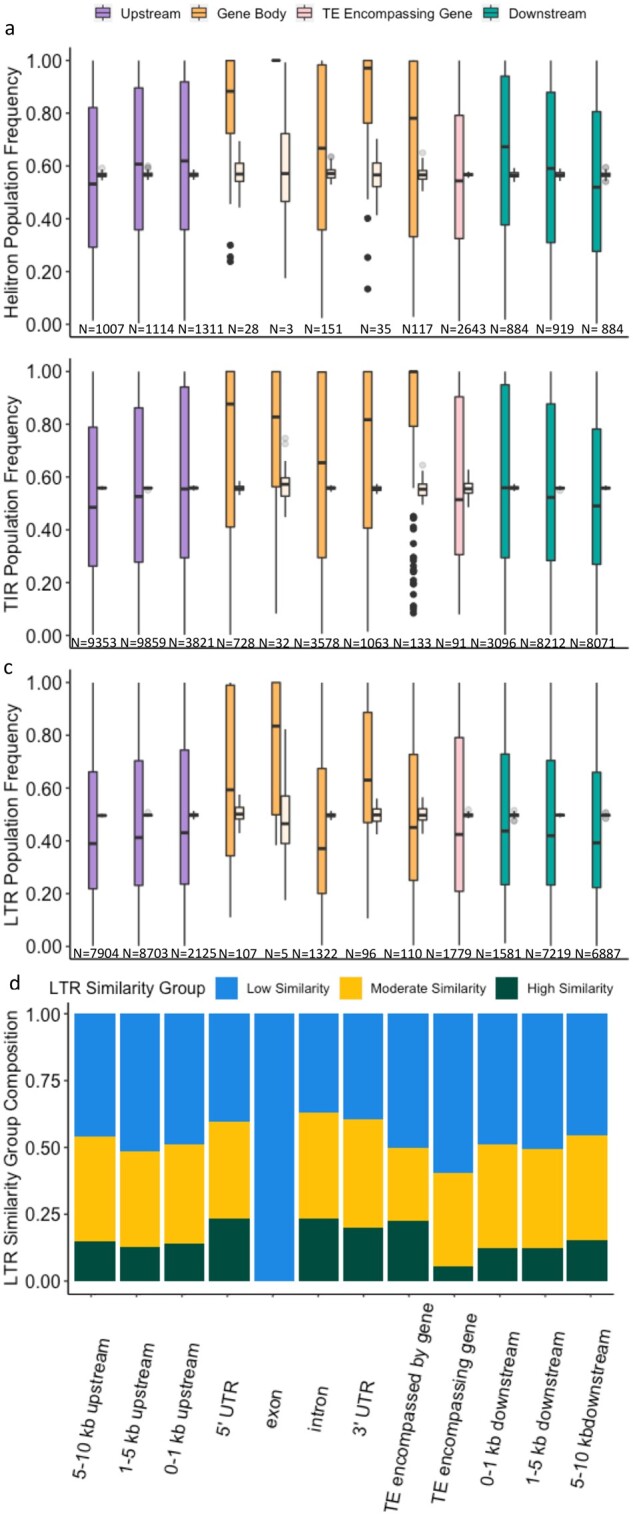
Figure 4.

Relationship between TE frequency and relative position to the nearest gene. Helitrons (A), TIRs (B), and LTRs (C) were categorized using the following hierarchy: gene completely within the TE, TE completely within the 5’ UTR, completely within the 3’ UTR, completely within an exon, completely within an intron, completely encompassed by a gene, 0–1 kb upstream of a gene, 1–5 kb upstream of a gene, 5–10 kb upstream of a gene, 0–1 kb downstream of a gene, 1–5 kb downstream of a gene, 5–10 kb downstream of a gene, intergenic (not shown in figure). Full colored bars (left bars) contain frequencies for TEs in each genomic region and transparent bars (right bars) contain frequencies for genome-wide background rates based on 100 bootstrap iterations. (D) Proportion of LTRs with low LTR similarity (LTR similarity <95%), moderate LTR similarity (LTR similarity between 95 and 99%), and high LTR similarity (LTR similarity >99%) in each gene proximity category.
