Figure 5.
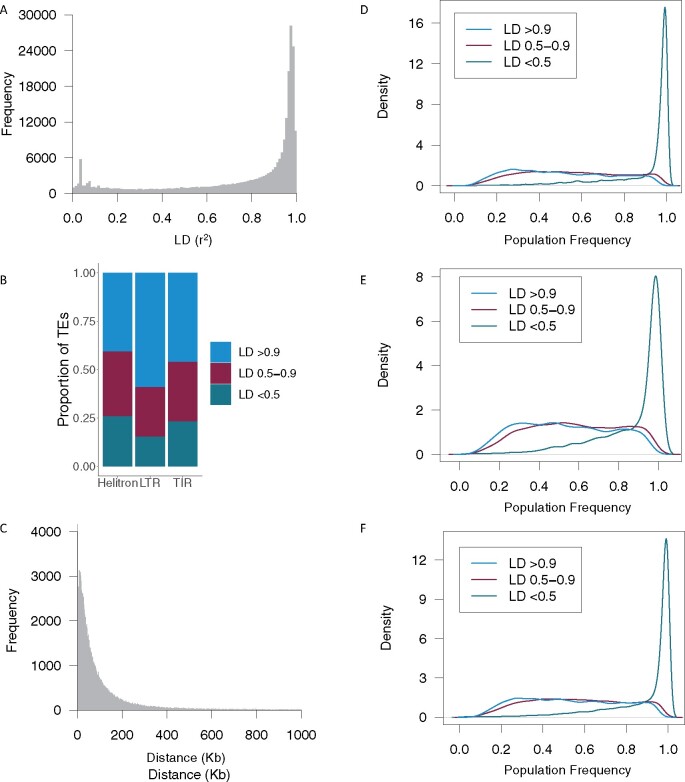
Linkage disequilibrium between TEs and SNPs in a panel of diverse inbred lines. (A) Linkage disequilibrium (LD) between TEs and the SNP with the highest LD within 1 Mb of the middle of the TE. (B) Proportion of TEs in high (r2 > 0.9), moderate (r2 0.5–0.9), and low (r2 < 0.5) LD with SNPs within 1 Mb of the middle of the TE. Category is based on the SNP with the highest LD in the window. (C) Distance between TEs and the SNP with the highest LD to it for TEs that had a SNP in high (r2 > 0.9) LD. Distance is calculated as the middle of the TE to the SNP. Only SNPs within 1 Mb of a TE were evaluated. (D–F) Density plots of population frequencies for TEs in high, moderate, and low LD with SNPs based on the highest LD within 1 Mb of the middle of the TE for LTRs (D), Helitrons (E), and TIRs (F). Only TEs with less than 25% ambiguous calls are included in these plots.

