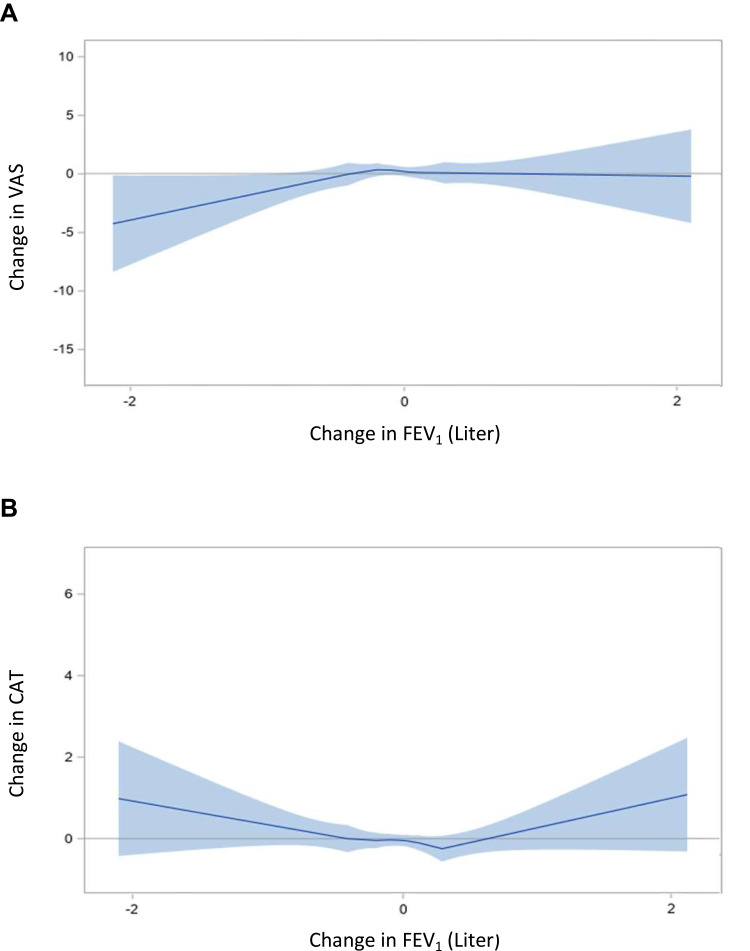
Figure 4.
Impact of clinical indicators on HRQoL: Linear relationship between change in FEV1 and VAS (A) and CAT (B).
Notes: The estimated smooth functions of the relationship between FEV1 and HRQoL are represented by the solid curves. The shaded areas indicate the 95% confidence intervals. Generalized additive models were adjusted for age, sex, smoking status, education, BMI, number of moderate and severe exacerbation, FEV1 liter change, Charlson Comorbidity index, mMRC, and VAS/CAT baseline.

