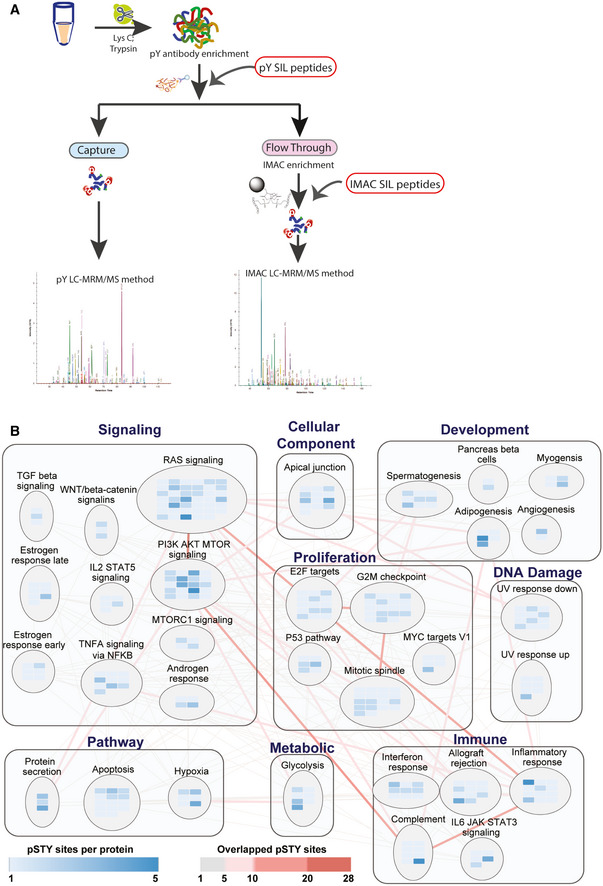
MSigDB Hallmark gene sets and process categories (Liberzon
et al,
2015) represented by SigPath. To be included in the plot, a pathway had to have at least 5% coverage, or be represented by a minimum of three proteins and five phosphosites in the assay. The RAS signaling pathway from WikiPathway (Martens
et al,
2021) is also included in the plot. Each rectangle assembles gene sets in the same process category. Gene set is shown in circles in which blue colored rectangles refer to the proteins represented in the assay. Shades of blue indicate the number of phosphosites per protein in the assay. Edges show overlapping proteins and phosphosites between the different gene sets. Overlap of 1–5 phosphosites is indicated with gray lines, whereas overlap of more than 5 phosphosites is shown with red lines at increasing intensity. The larger the overlap, the more intense is the shade of red.

