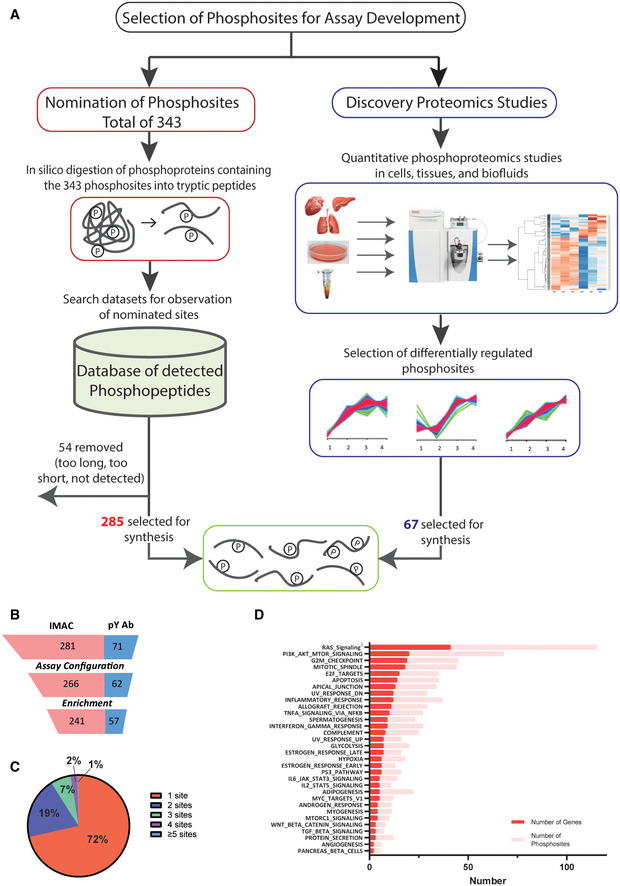
Figure EV1. Development of SigPath assay.

-
AProcess for selecting phosphosites and phosphopeptides for SigPath assay development. Majority of phosphosites were nominated by experts, then converted into tryptic peptides, searched against existing datasets at the Broad for detection of them in MS data (see Materials and Methods section). One‐fourth of the phosphosites were included based on them being differentially regulated in quantitative phosphoproteomic studies (Mertins et al, 2014). Once finalized [C13, N15], stable isotope‐labeled versions of the peptides were synthesized for the assay.
-
BAssay configuration and testing statistics of SigPath. Twenty‐four out of 352 peptides failed the assay configuration due to their LC or MS characteristics, while another 30 failed during the pY Ab or IMAC enrichment step. Final SigPath assay targets 298 phosphopeptides with 284 phosphosites.
-
CPie graph showing range of phosphosites per protein in the assay panel. 71% of the proteins are represented by only one phosphopeptide, 19% by two phosphopeptides. The remaining varies from 3 to 9 phosphopeptides.
-
DPathways represented by SigPath in MSigDB Hallmark pathway category. To be included in the plot, a pathway had to have at least 5% coverage, or be represented by a minimum of three proteins and five phosphosites in the assay. Both, number of genes (red) and phosphosites (pink) are shown on the plot. 1Included from MSigDB WikiPathway pathway category.
