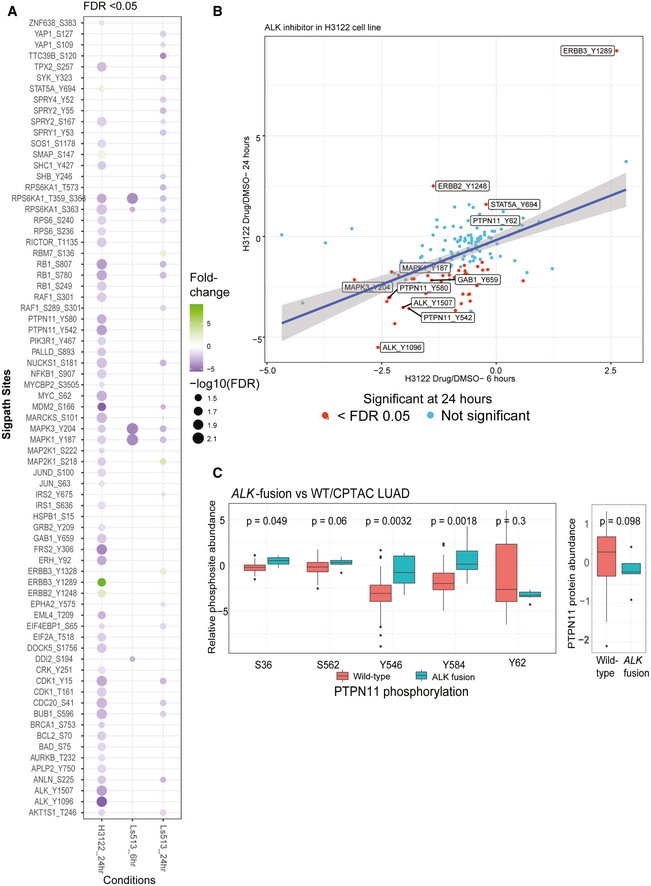
Figure 2. SigPath analyses of cancer cell line perturbation experiments.

-
ASummary of all significantly regulated phosphosites observed in H3122 and Ls513 cell lines. The log2‐transformed light/heavy peak area ratios for two replicates per time point and treatment were used to compare drug treatment to DMSO. SigPath phosphopeptides differentially regulated upon treatment in each of the conditions in a moderated two‐sample t‐test (adj. P‐value < 0.05) are shown as circles. H3122 6‐h experiment did not yield any significant regulation and hence not shown on the figure. The color indicates fold change relative to DMSO, and the size of the circle indicates log10 (FDR).
-
BScatter plot showing fold change of SigPath sites relative to DMSO for H3122 cell line treated with ALK inhibitor. X‐axis and Y‐axis show 6‐h and 24‐h time points, respectively. The red dots indicate sites with FDR < 0.05. Highlighted are a subset of key differentially regulated phosphosites.
-
CBox plot showing relative abundance of detected PTPN11 phosphosites and PTPN11 protein in the CPTAC LUAD tumors with and without ALK fusion (Gillette et al, 2020). The box represents interquartile range (IQR) with the lower, central, and the upper bands representing 25th percentile (Q1), median, and 75th percentile (Q3), respectively. The lower and upper whiskers represent Q1‐1.5*IQR, and the upper whisker shows Q3+1.5IQR. The data summarized represents patients wild type (n = 103) and mutant (n = 7). PTPN11 pY546 and pY584 sites showed the most significant upregulation (P‐value < 0.01, Wilcoxon test) in tumors with ALK‐fusion.
