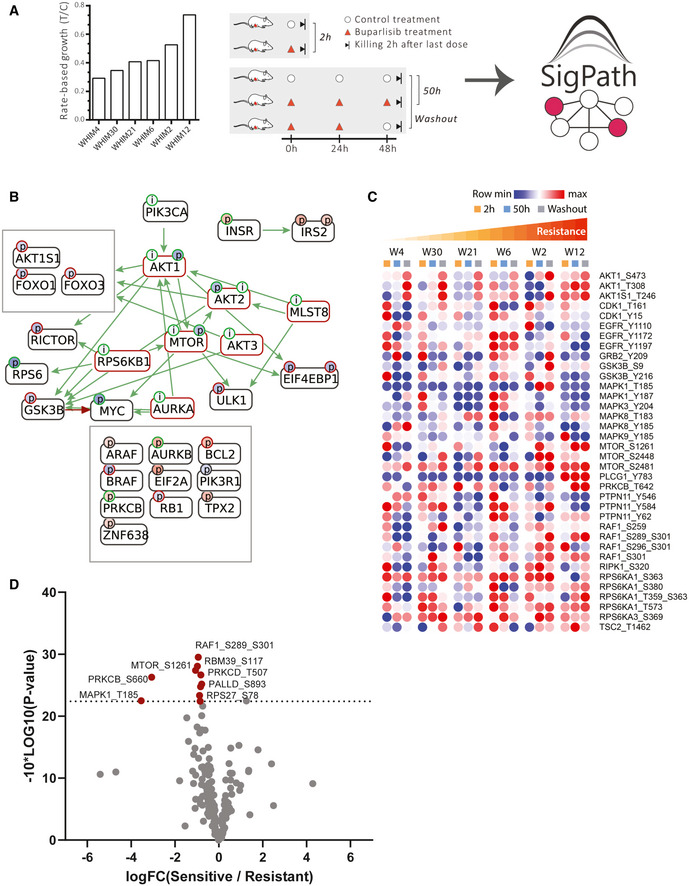
Figure 3. Application of SigPath to understand mechanisms of response and resistance of triple‐negative breast cancer to therapy.

-
ASix patient‐derived xenograft models of triple‐negative breast cancer were assessed for their resistance to buparlisib, a PI3K inhibitor, and analyzed for their proteome and phosphoproteome (Mundt et al, 2018). The six models ranked after their resistance, from most sensitive to the left (WHIM4), to most resistant to the right (WHIM12). The resistance is calculated as rate‐based growth (treatment over control; T/C). Each PDX model was then treated with buparlisib or vehicle and tumors were collected at hours 2 or 50 (buparlisib/vehicle administered at hours 0, 24, and 48). Each of these six models subjected to five different treatments results in a total of 30 samples that were analyzed with the SigPath assay.
-
BCausalPath (www.causalpath.org) analysis of 2‐h drug/vehicle treatment data. Log2 (L/H PAR) for all 6 WHIM models was used for this analysis. Moderated one‐sample t‐test was used to analyze 2‐h treatment data. Resulting table was used for the CausalPath analysis. CausalPath network generated by comparing drug‐treated PDX samples to the controls at 2 h. Nodes represent proteins, and the (p) labels on the nodes represent significant differences in site‐specific phosphopeptide measurements. (p) Blue background color indicates a downregulated site, red background color indicates an upregulated site. Green border color around (p) indicates an activatory site, and a red border color indicates an inhibitory site. Green edges represent known site‐specific phosphorylations, and red edges represent dephosphorylations. The label (i) indicates an inhibited protein. In the case of PI3KCA, the label (i) indicates our manually inserted hypothesis of inactivated PIK3CA due to the drug effect. All other (i) labels on the graph are generated automatically by the CausalPath algorithm through statistical evaluation of the changes at the downstream of the protein. CausalPath infers the PI3KCA ‐> AKT1 relation, indicating the downregulated phosphorylation of AKT1 is likely due to inhibition of PIK3CA. Additionally, statistical measurements on the downstream of AKT proteins indicate their inactivation. We observe that this effect extends over downstream targets of AKT such as mTOR.
-
CHeat map of 36 sites from Hallmark’s PI3K_AKT_mTOR pathway and mTOR, including MAPK3_Y204, detected in SigPath assay. Ratio of buparlisib treatment to vehicle for each time point is used. WHIMs are listed in the order of their resistance to buparlisib treatment. The row min, row max color scheme has been applied after the rows have been adjusted to robust Z‐scores (subtracted median and divided by the median absolute deviation; median‐MAD).
-
DVolcano plot comparing resistant versus sensitive models in 50‐h treatment samples. Sensitive (WHIMs 4, 30, 21, and 6) and resistant (WHIMs 2, and 12) are compared in a two‐sample moderated t‐test. Log2 fold changes are shown on the x‐axis, −10*log10 (P‐value) derived from the two‐sample moderated t‐test are shown on the y‐axis. Red dots indicate the 10 peptides significantly regulated with adj. P‐value threshold of < 0.1.
