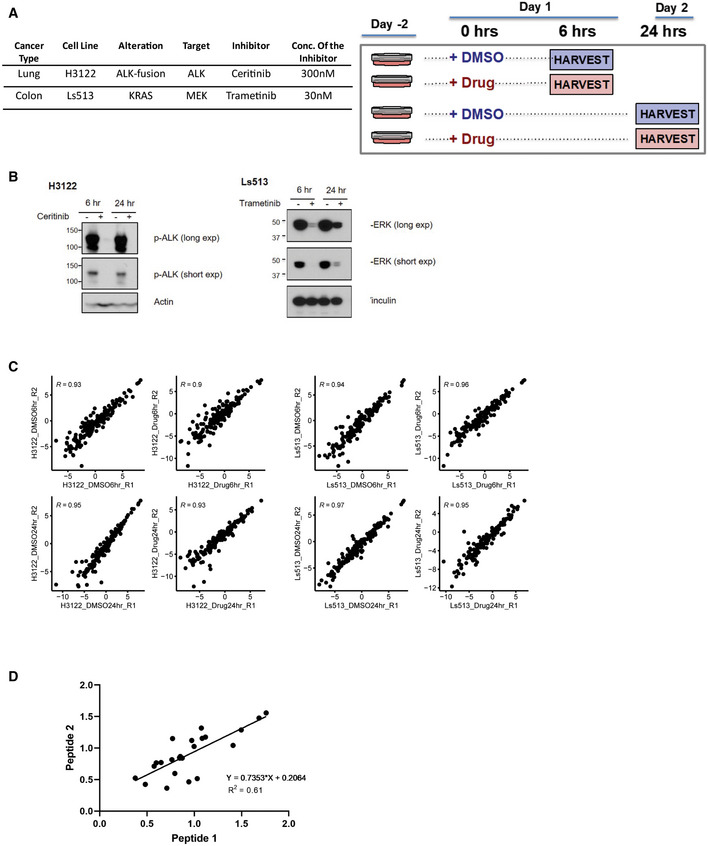
Figure EV3. Application of the assay to cancer cell line perturbagen experiments.

-
AExperimental design and details for drug treatment studies in H3122 and Ls513 cell lines. Table contains details about the cell lines as well as the inhibitor and concentration of it used. Cells were treated either with the inhibitor or DMSO for 6 and 24 h. Two process replicates were collected for each sample.
-
BInhibition of pALK and pERK signaling in established human cell lines. Immunoblot analyses of cultured H3122 lung adenocarcinoma cells (on the left) treated with ALK inhibitor Ceritinib (+) or DMSO (−) for 6 and 24 h. Antibodies recognizing the phosphorylated 1507‐Tyrosine site of the ALK protein and the Actin protein (loading control) were used. Immunoblot analyses of cultured Ls513 colorectal carcinoma cells (on the right) treated with KRAS inhibitor Trametinib (+) or DMSO (−) for 6 and 24 h. Antibodies recognizing the phosphorylated Thr 185/Tyr 18 sites of the ERK1/ERK2 proteins and the vinculin protein (loading control) were used.
-
CScatter plot of two process replicates of Log2 light/heavy PAR of each sample group. Shown on each plot is the Pearson correlation coefficient.
-
DScatter plot of light/heavy peak area ratio of peptide 1 and peptide 2 measuring the same site for 12 of the sites measured in H3122 and Ls513 perturbagen experiments. X‐axis and y‐axis represent light/heavy peak area ratios. Shown on the graph is Pearson correlation coefficient.
