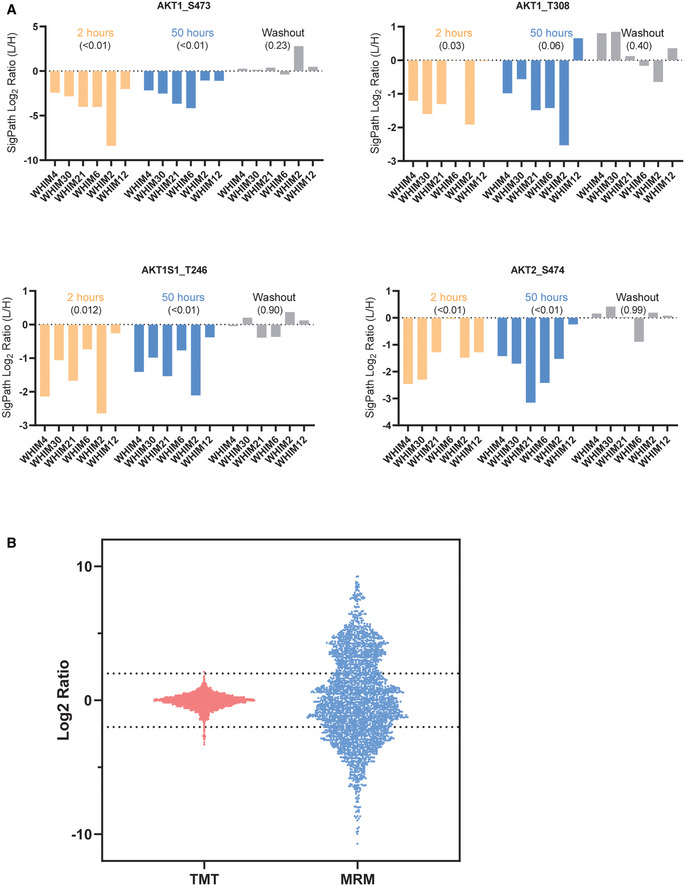
ALevels of AKT pS473, AKT pT308, AKT1S1 pT246, and AKT2 pS474 which are all pharmacodynamic markers for PI3K inhibition observed using SigPath. For each graph, and treatment in each graph, the WHIM/PDX models are sorted in the order of their resistance to the drug with least resistance on the left. Across all markers, the most resistant model (WHIM12) is the least affected at 50 h of buparlisib treatment. P‐values, in round brackets “()”, are calculated from a one‐sample t‐test, compared to a hypothetical mean of 0, using all WHIMS as replicates for a certain treatment.

