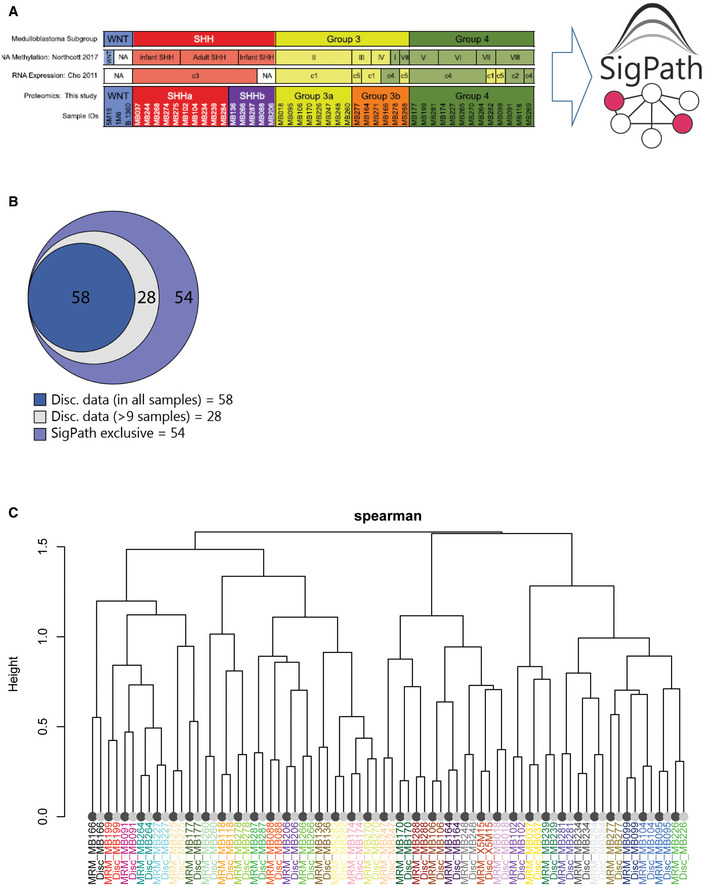
Figure EV5. Application of the IMAC subset of the SigPath assay to human tissue samples from medulloblastoma patients.

-
AList of samples used for this experiment and their classification to SHH, GR3, and GR4 as well as subgroups within SHH and GR3 (Archer et al, 2018). Only IMAC subset of the assay has been applied to these samples.
-
BVenn diagram showing the overlap of the 140 sites detected in SigPath assay with the discovery data. 86 peptides were detected in both datasets, 58 of these were detected in the discovery dataset in all samples (dark blue) while another 28 detected in at least 9 samples (light blue) of the discovery dataset. 54 sites (39%) were unique to SigPath assay (violet).
-
CDendrogram illustrating the clustering of MRM (dark leaves) and discovery data (light leaves) of 86 phosphosites detected in both assays. Colors of sample identifiers are coordinated by patients. Log2 TMT ratio of each sample to the pooled reference was used for the discovery data after median‐MAD normalization. Log2 light/heavy ratios of SigPath data were used after normalizing each peptide by the median log2 light/heavy ratio across all samples. The dendrogram was derived from complete‐linkage hierarchical clustering using 1‐Spearman correlation as the distance metric. All sample pairs (MRM/discovery) cluster adjacent to each other.
