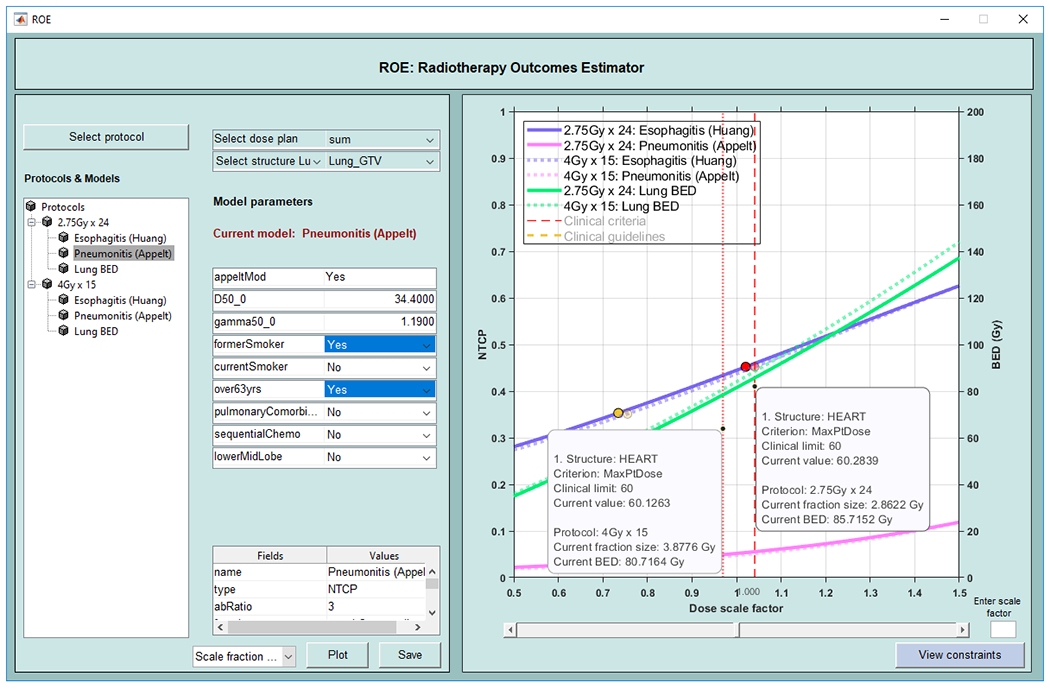
Figure 5:

Radiotherapy Outcomes Explorer (ROE). Graphical user interface allows the selection of protocols which includes models and constraints. Additionally, users can input risk factors for the patient. NTCP curves for esophagitis and pneumonitis models and TCP curve for BED are shown in this example along with the points on the NTCP curves where the clinical limits are reached.
