
Figure 10. The association between the -α 3.7I deletion and SNPs within the surrounding region with severe malaria.
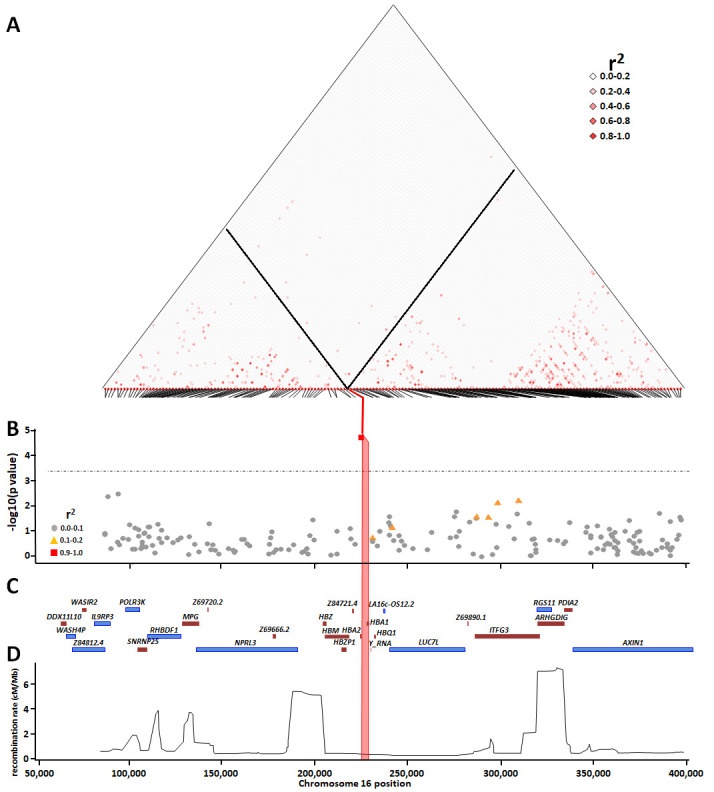
Panel A shows pairwise squared correlations (r 2) between genotypes at regional variants. Black lines denote the values for -α 3.7I deletion for SNPs within the region. The angled lines at the base of the linkage disequilibrium map identify each SNP and where it aligns to the chromosome. Panel B shows a Manhattan plot illustrating the p-values for the associations between individual SNPs within the HBA region and severe falciparum malaria; the horizontal dotted line shows the Bonferroni-correction significance threshold (p<0.0003); r 2 shows the correlation between α-thalassaemia and the other SNPs. Panels C and D show the gene map and recombination map, respectively. The pink vertical box in panels B, C and D shows the location of -α 3.7I deletion.