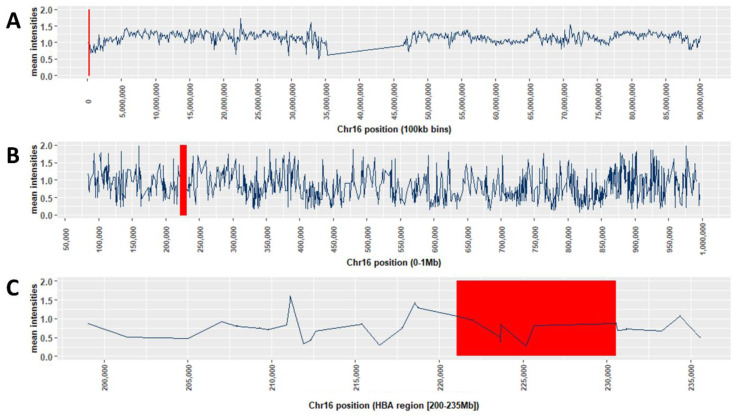
Figure 11. Mean of the Sum(X + Y) intensities for 3036 samples for SNP features on chromosome 16.
A: Mean channel intensities (X + Y) for 3036 samples used in the study, averaged over 100kb bins for chromosome16 B: Mean channel intensities (X + Y) for 3036 samples for individual SNPs in the 5’ 0-1Mb telomereic region of chromosome 16 C: Mean channel intensities (X + Y) for 3036 samples for individual SNPs in the HBA gene region of chromosome 16 The red rectangle in each plot shows the location of the -a 3.7 deletion.

