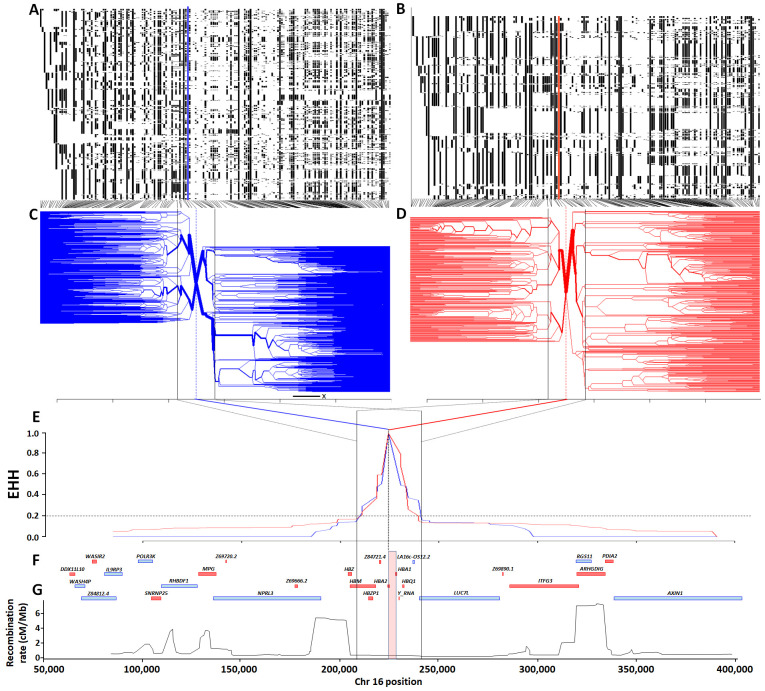
Figure 7. Haplotype, extended haplotype homozygosity (EHH) and bifurcation diagrams for the HBA region in Kilifi, Kenya.
Panels A and B show haplotype maps for the -α 3.7I-reference and -α 3.7I-deletion haplotypes respectively (chromosomes are aligned as rows and SNPs in columns; white = reference and black = alternate), while panels C and D show corresponding bifurcation diagrams for the -α 3.7I-reference and -α 3.7I-deletion haplotypes respectively. Panel E shows EHH plots for -α 3.7I-reference and -α 3.7I-deletion haplotypes with the deletion allele as the focal point. Panels F and G show a gene map, and a recombination map based on African sequence data. The red and blue vertical lines in panels C and D denote the position of the -α 3.7I–INDEL, as does the pink vertical box in panel G which is scaled to the width of the deletion.

