
Figure 4. Chip Intensity (sum[X and Y] channels) density plots for features internal and immediately flanking the α -3.7 deletion.
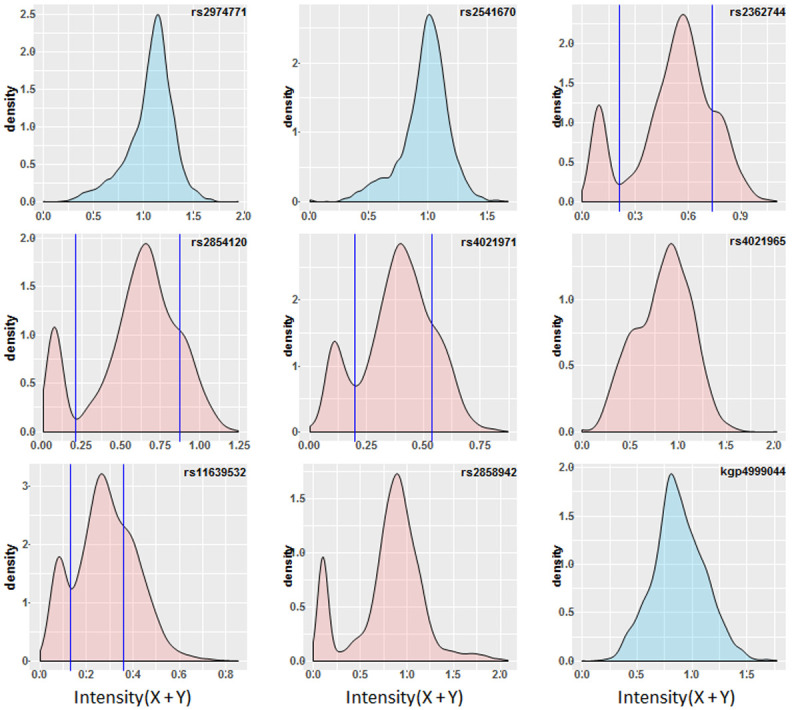
Features filled in blue are flanking to the deletion (rs2972771 and kgp4999044 are present in the haplotype SNP data, rs2541670 did not pass QC). Features filled in red are within the -α 3.7 deletion. Vertical lines illustrate where both a trough and shoulder are discernible in the distribution and potentially infer the breaks between genotypic groups; rs2362744 0.211 and 0.738; rs2854120 0.215 and 0.869; rs4021971 0.199 and 0.538; rs11639532 0.131 and 0.358.