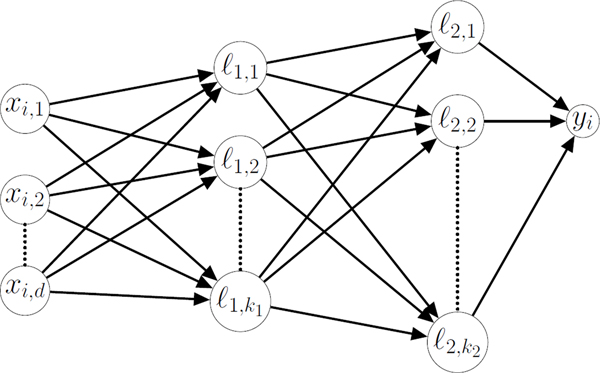
Figure 2. Example Neural Network.
A schematic of a neural network, where x is a vector of input data for d input features where xi, v is the vth feature for the ith participant and yi is the network output for the ith participant. In the case of the continuous neural network, yi is a continuous variable representing the network’s prediction of the time of DLMO for the ith participant. In the case of the classification neural network, yi falls between 0 and 1 and if yi< 0.5, the timepoint is classified as falling before DLMO. Nodes lm,n represent hidden nodes in the network, where m is the layer of the node, and n is the index of the node within each layer. The value of each node is determined by for bn a fit constant. The number of nodes in each layer, km for bn a fit constant. The number of nodes in each layer, km, is a hyperparameter which was selected through cross validation.

