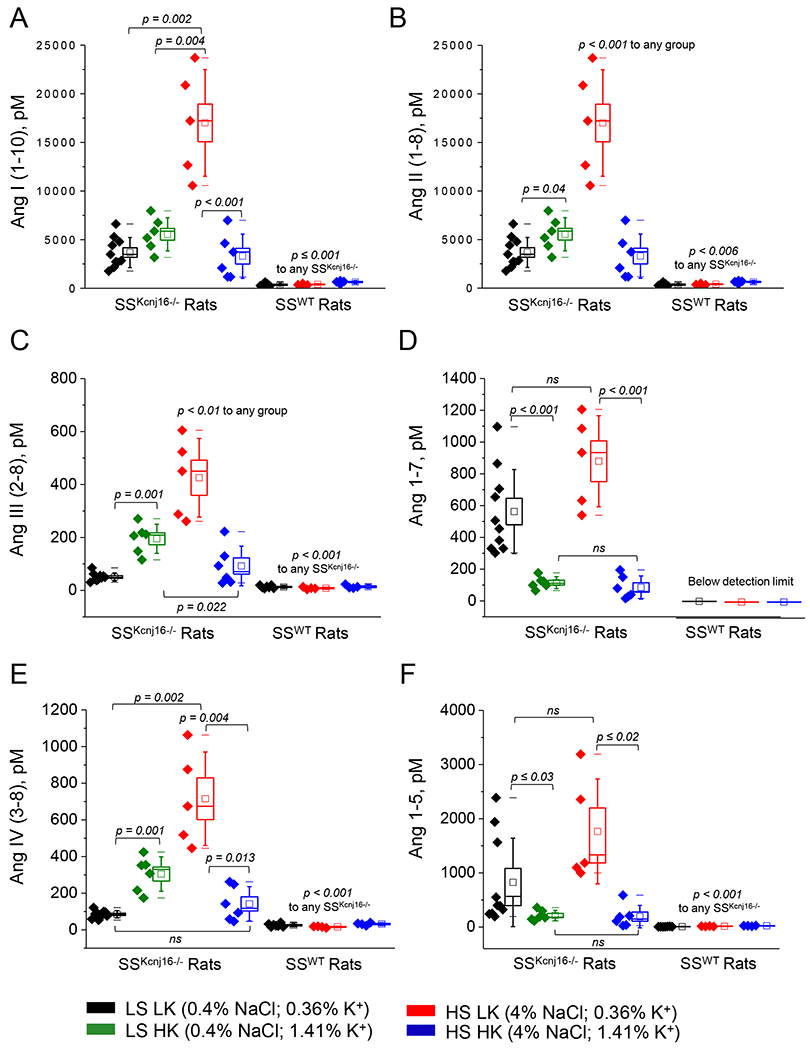
Figure 1. Quantification of equilibrium angiotensin metabolites in SSKcnj16−/− and SSWT rats.

Ang I (1-10) (A), Ang II (1-8) (B), Ang III (2-8) (C), Ang 1-7 (D), Ang IV (3-8) (E), and Ang 1-5 (F) were quantified from SSKcnj16−/− (N=5-10 males) and SSWT (N=4-7 males) plasma samples collected from rats being fed one of 4 diets. In the boxplots, black data points denote rats fed a low salt, low potassium diet (LS LK, 0.4% NaCl and 0.36% K+); green indicates a low salt, high potassium diet (LS HK, 0.4% NaCl and 1.41% K+); red indicates a high salt, low potassium diet (HS LK, 4% NaCl and 0.36% K+); and blue indicates a high salt, high potassium diet (HS HK, 4% NaCl and 1.41% K+). Please see Figure S1 for expanded scale of angiotensin derivatives in SSWT rats. Measurements are shown in pM. Bounds of boxes represent SEM, whiskers span 3 standard deviations, median is denoted by a horizontal line, and mean is denoted by a square within each box. p-values are given for each graph.
