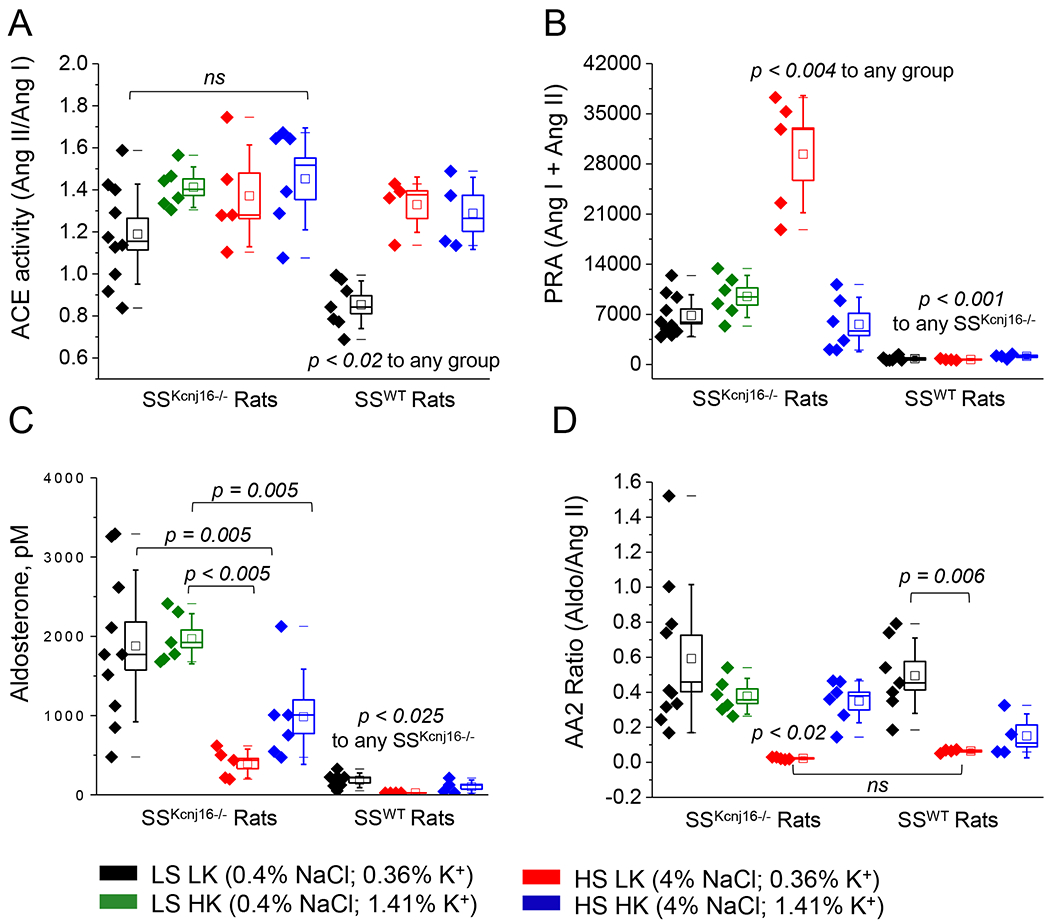
Figure 2. Equilibrium aldosterone and surrogate RAAS measures in SSWT and SSKcnj16−/− rats.

RAAS components were quantified using a mass spectrometry-based analysis of plasma samples collected from SSKcnj16−/− (N=5-10 male) and SSWT (N=4-7 male) rats fed one of 4 diets as described in Figure 1. (A) ACE activity indicated by the ratio of plasma Ang II to Ang I. (B) Plasma renin activity (PRA) represented by the combined content of Ang I and Ang II in pM. (C) Plasma aldosterone in pM (please see Figure S2 for expanded scale of aldosterone level in SSWT rats). (D) The ratio of aldosterone to Ang II (AA2 ratio). Bounds of boxes represent SEM, whiskers span 3 standard deviations, median is denoted by a horizontal line, and mean is denoted by a square within each box. p-values are given for each in the figure graph.
