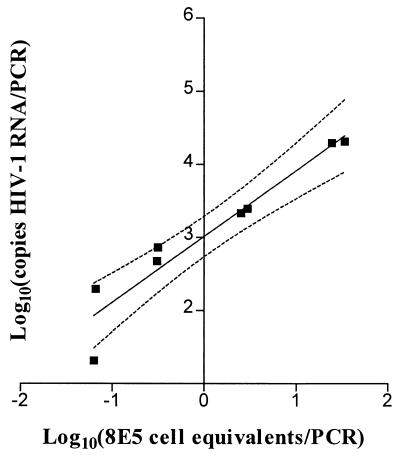
FIG. 2.
Cell mixing experiment to assess the linearity of HIV-1 RNA measurement in cellular specimens. RNA was extracted from frozen cell pellets representing mixtures of HIV-infected cells (8E5) and uninfected cells (H9). Specimens had been mixed to contain 2, 10, 100, or 1,000 8E5 cells per 106 H9 cells and 106 cells per pellet (n = 8; four duplicate measurements). Aliquots containing 297 to 409 ng of total RNA were measured by PCR. Linear regression analysis (r2 = 0.91; n = 8) as shown by the solid line and the 95% confidence intervals (dotted lines) results in an equation of y = (0.90 ± 0.11)x + (3.01 ± 0.11) (the slope and the y-intercept values are indicated as mean ± SE).

