Figure 1.

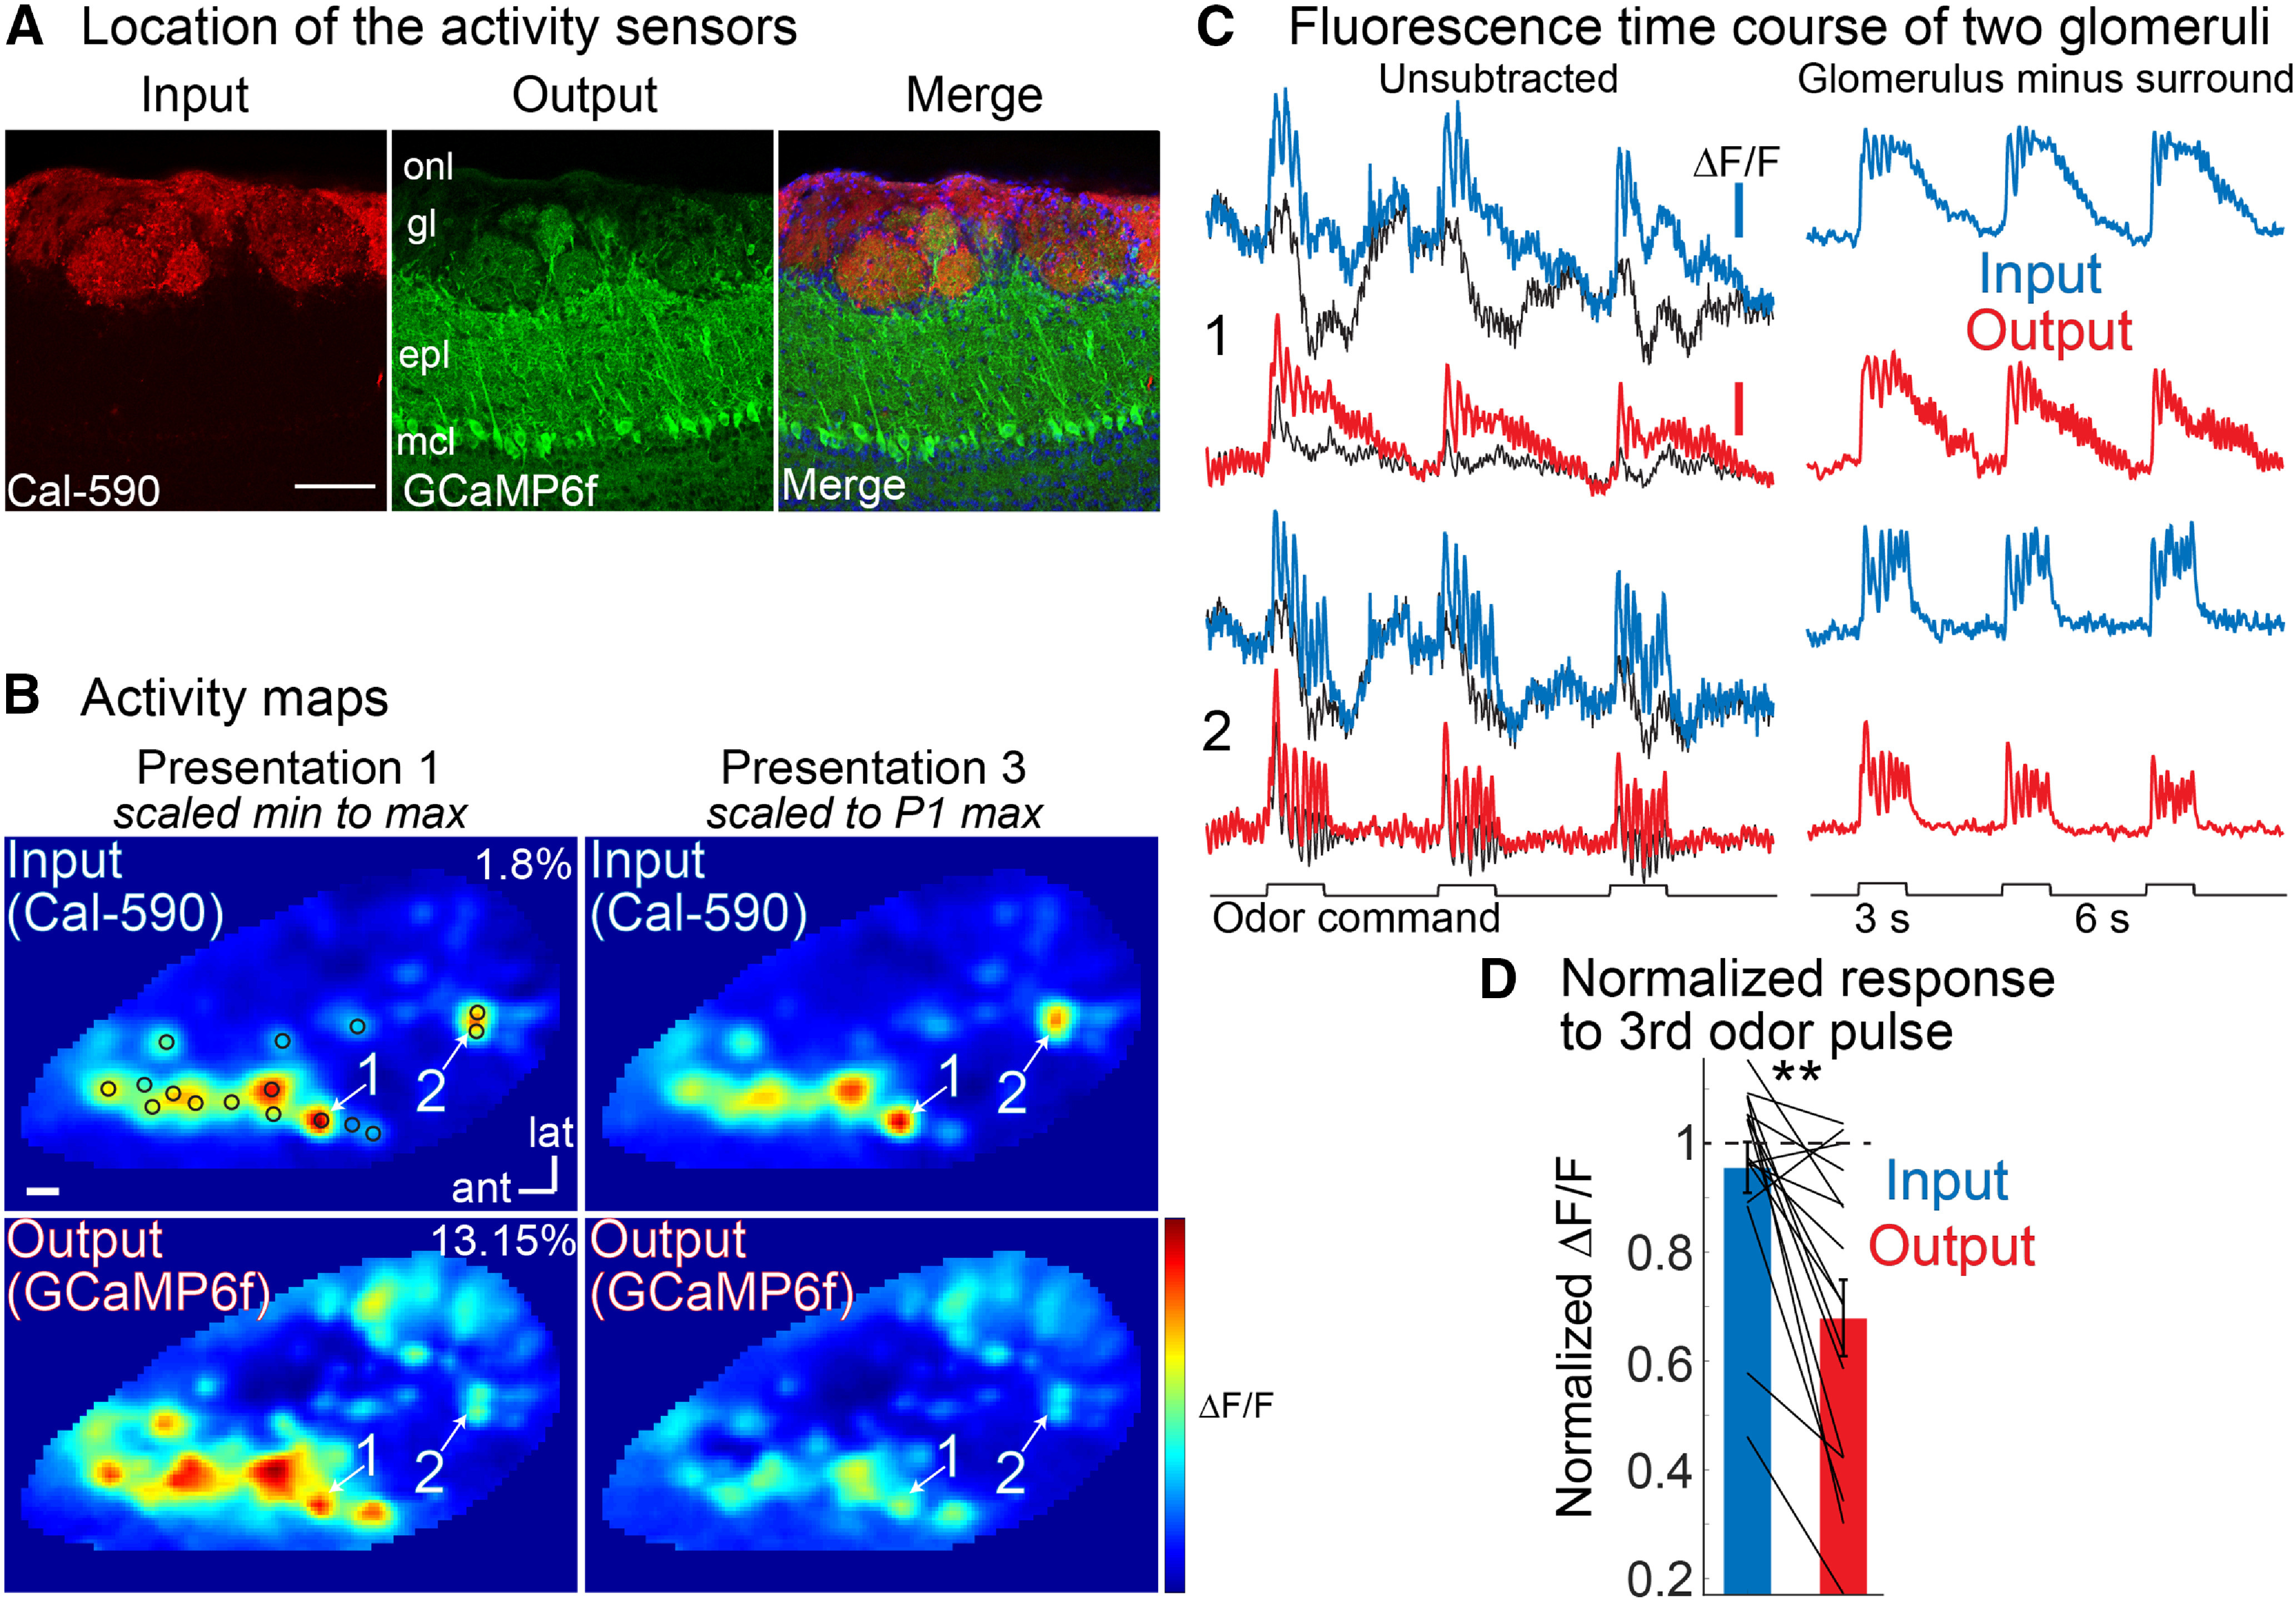
Measuring the olfactory bulb input-output transformation using wide-field imaging reveals a contribution to adaptation. A, Histology illustrating spectrally distinct sensors targeted to input (Cal-590) and output (GCaMP6f). B–D, Strobing LEDs were used to image input and output on alternate camera frames in response to repeated odor presentations. Strobing did not noticeably impact the signal-to-noise ratio (Extended Data Fig. 1-1) and the olfactometer delivers repeatable odor pulses (Extended Data Fig. 1-2). B, Input (top, left) and output (bottom, left) activity maps are shown in response to the first odor presentation scaled to their minimum and maximum ΔF/F values (max ΔF/F indicated on panel). The activity map evoked by the third odor pulse (right panels) is shown with the color scale set to the maximum ΔF/F value evoked by the first odor pulse. C, Fluorescence time course of input and output for two glomeruli from one of the single trials used to generate the activity maps in panel B. Unsubtracted, The colored traces are from the center of the activated glomeruli. The signal from the immediate surround is shown as the superimposed thin black trace. Glomerulus minus surround, Fluorescence traces that have had the surround subtracted from the glomerular center. The odor used was methyl valerate at 2% of saturated vapor. D, Quantification of the response to the third odor presentation normalized to the first odor presentation (N = 16 glomeruli). The dashed line represents the result for zero adaptation; **p < 0.005. The scale bars in panels A, B indicate 100 μm, and the scale bars in panel C indicate 1% and 5% ΔF/F, respectively. Similar results were obtained using different sensor combinations (Extended Data Figs. 1-3, 1-4, 1-5, 1-6 1-7). onl, olfactory nerve layer; gl, glomerular layer; epl, external plexiform layer; mcl, mitral cell layer; ant, anterior; lat, lateral.
