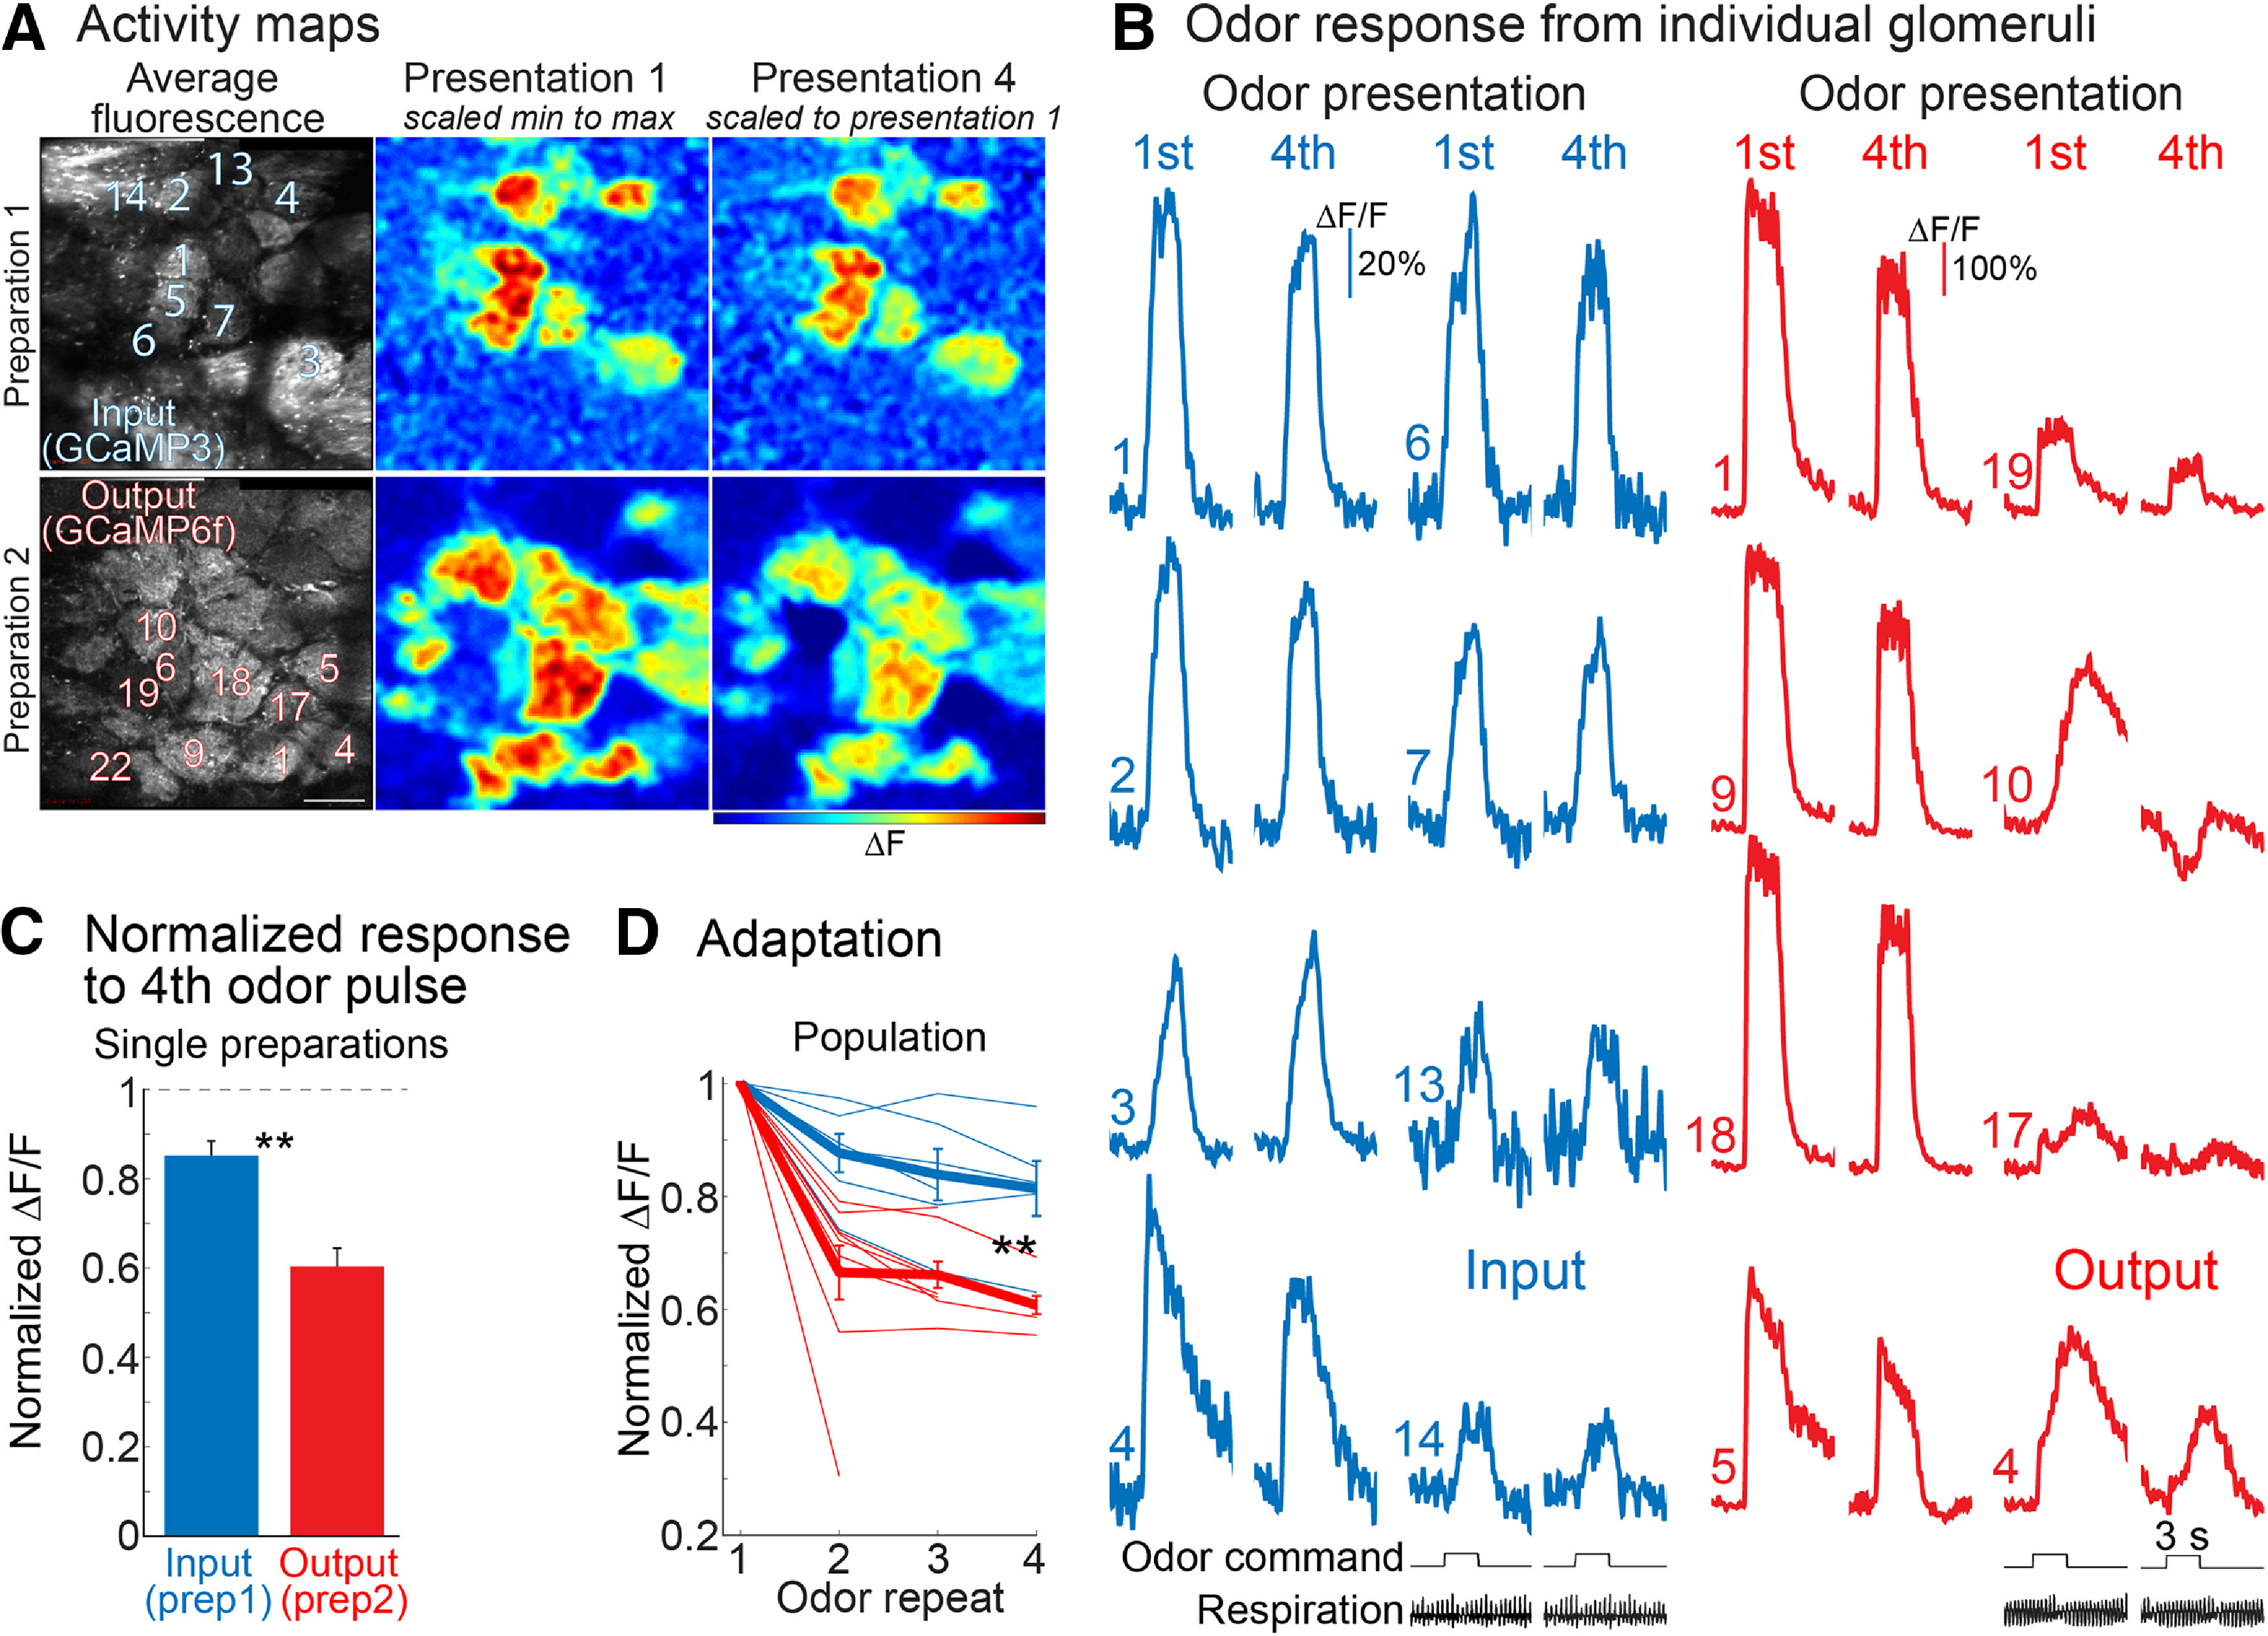
Figure 3.

Adaptation of input and output responses measured in different, anesthetized preparations using two-photon imaging. A, Average fluorescence intensity and activity maps from two different preparations in which input (GCaMP3) or output (GCaMP6f) were measured separately. The input maps are relatively similar for the first and fourth odor presentation while the signals in the fourth output map are smaller. Scale bar: 100 μm. B, Fluorescence time courses from activated glomeruli measured in the two preparations in A. The response to the first and fourth odor presentation are cropped and displayed next to each other. The output traces in panel B are from a single trial, the input traces are from an average of four trials. The heterogeneity of the output responses is further illustrated in Extended Data Figures 3-1, 3-2. C, Quantification of the signal size of the fourth odor presentation normalized to the amplitude evoked by the first odor presentation for all of the glomeruli identified in these two recording trials. The dashed line represents the result for zero adaptation. D, Population summary of adaptation of input and output. Each thin line is from a different preparation. The input and output recordings in A, B were measured in response to ethyl tiglate (2% saturated vapor) and methyl valerate (2% saturated vapor), respectively; **p < 0.005.
