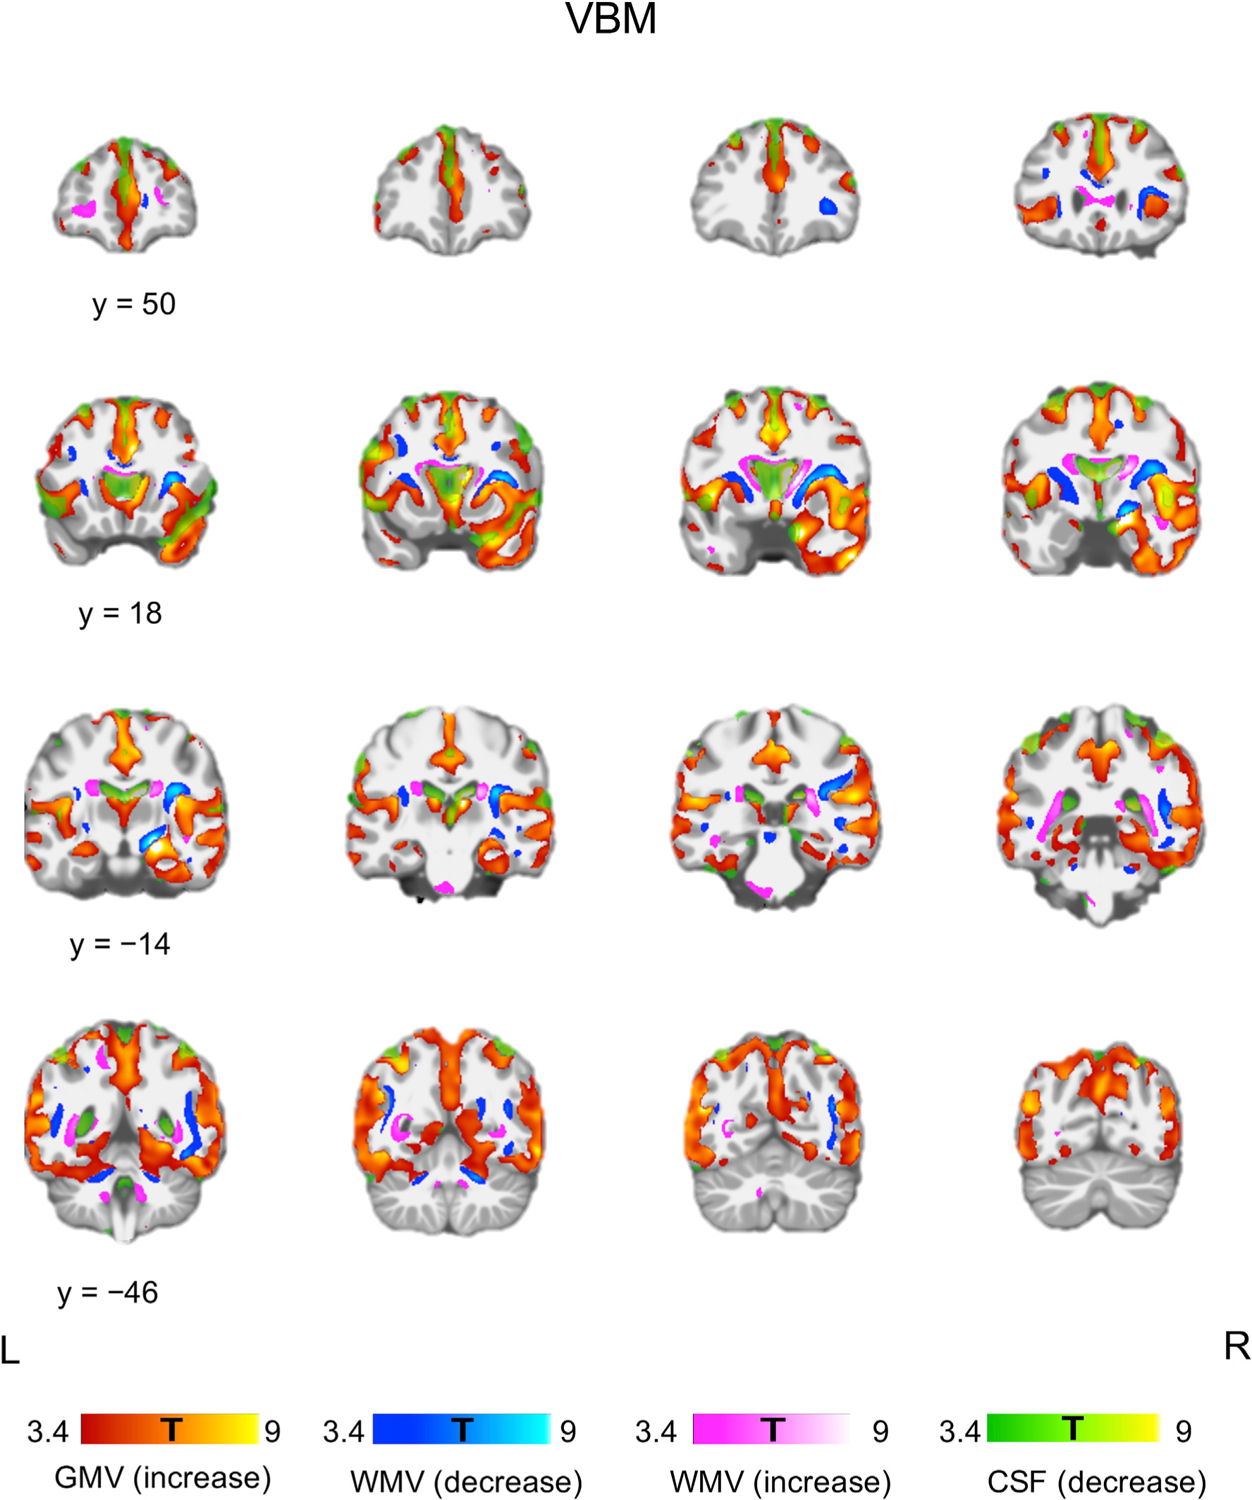
Fig. 1.

Tissue-specific volume change following ECT. VBM showed bilateral GMV increase and CSF decrease. WMV increase was observed in the periventricular regions, and WMV decrease was observed adjacent to the regions of GMV increase. Each color bar at the bottom of the figure represents the T-values derived from the VBM results. (For interpretation of the references to color in this figure legend, the reader is referred to the Web version of this article.)
