
Fig. 2.
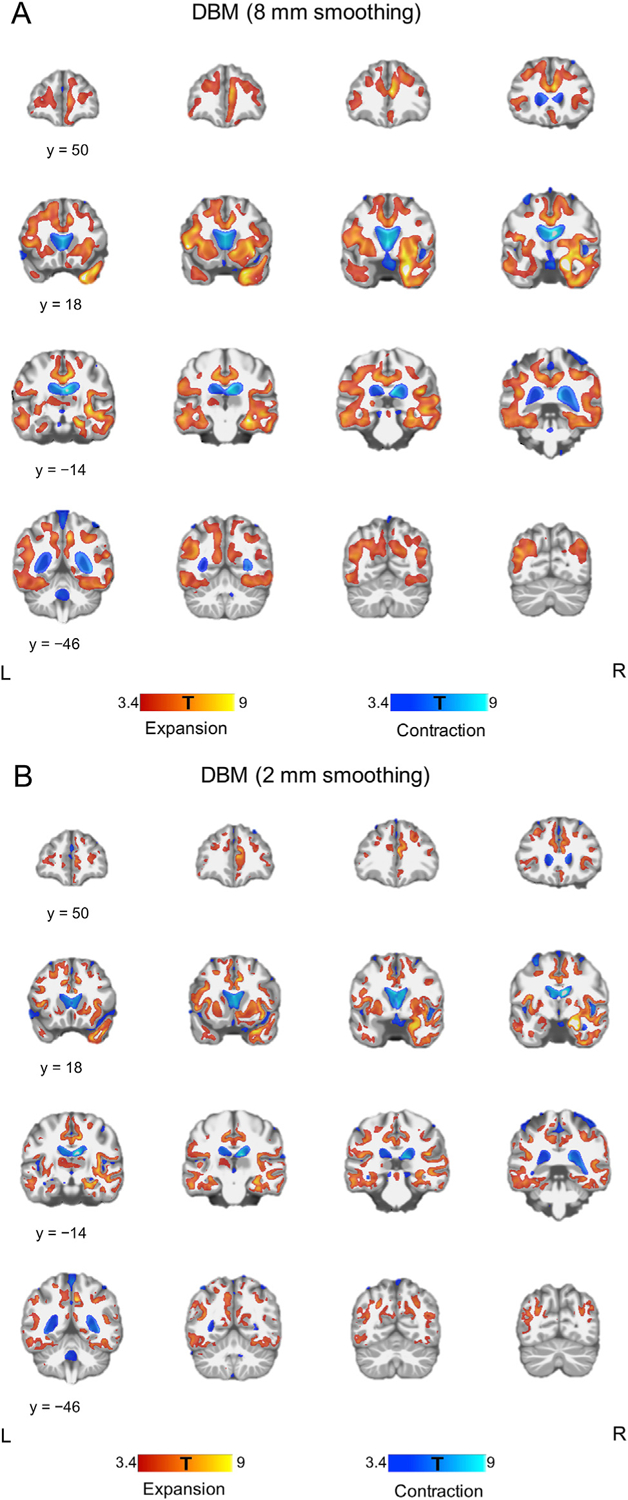
Global volumetric change following ECT. (A) DBM using images smoothed with an 8 mm kernel showed bilateral volume expansion in GM and WM with contraction in the CSF compartments. (B) DBM using images smoothed with a 2 mm kernel revealed that volume expansion was mainly located in the GM. Each color bar at the bottom of the figure represents the T-values derived from the DBM results.