
Fig. 3.
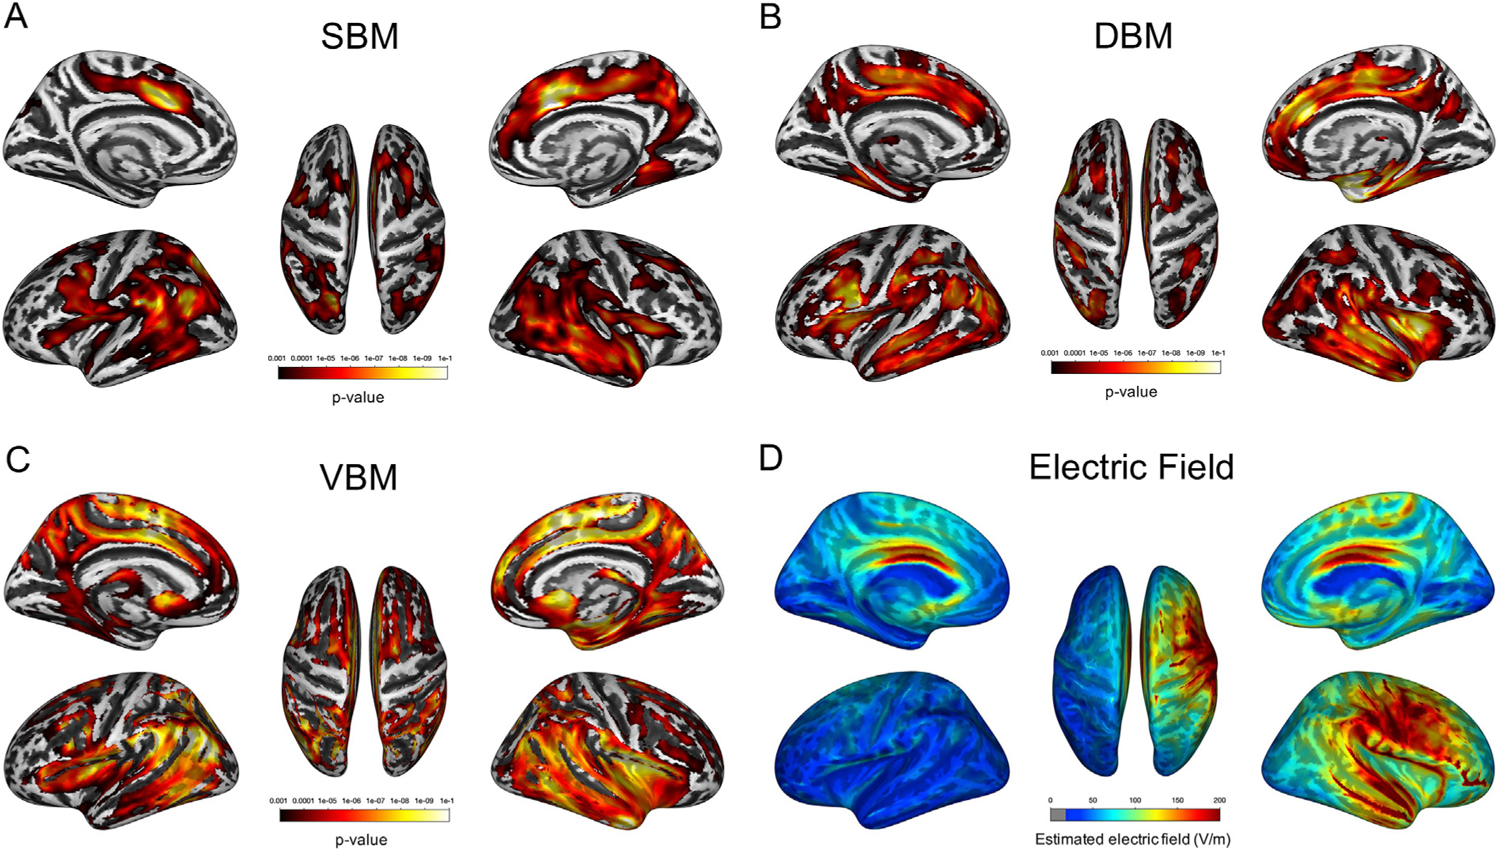
Results of morphometry analyses following ECT and estimated electric field strength. (A–C) SBM and DBM identified almost identical brain regions, whereas VBM showed a more widespread volumetric change pattern following ECT. Each color bar represents the p-value associated with the respective whole-brain analysis. (D) Fig. 3D shows the mean image of the estimated electric field strength in all participants. The color bar represents electric field strength (V/m).