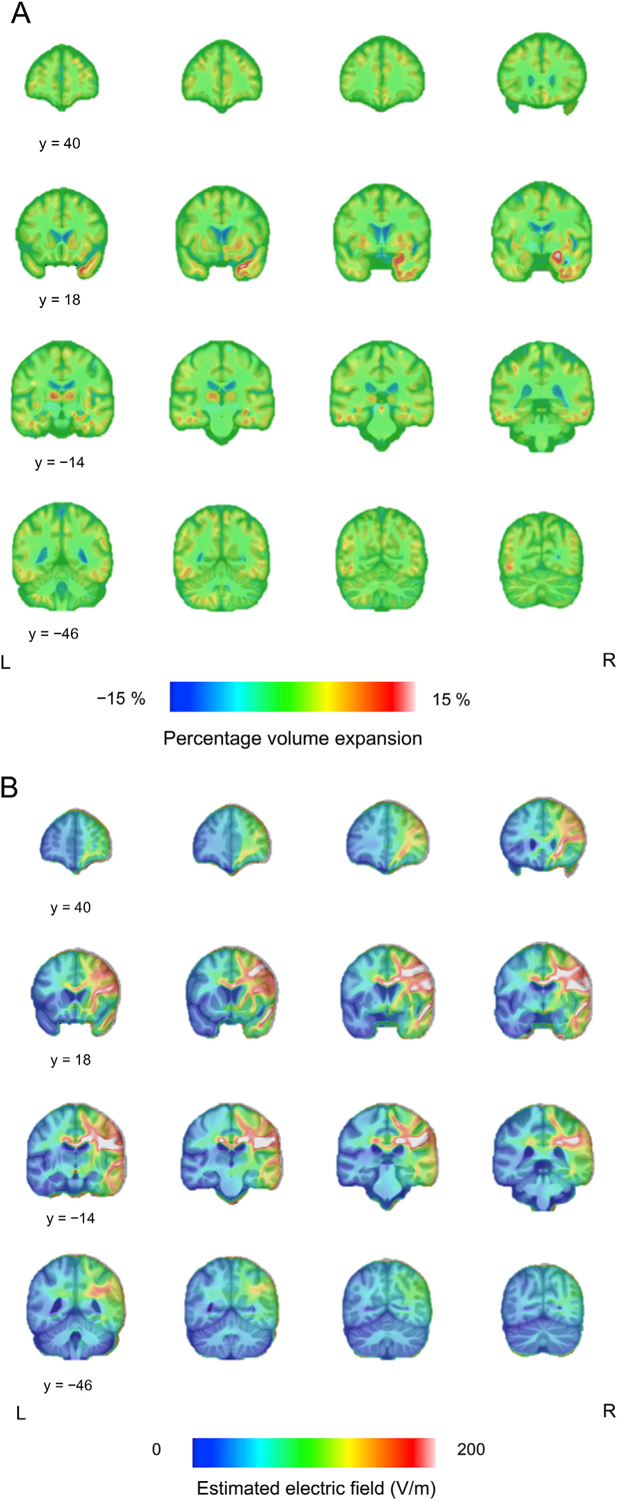
Fig. 4.

Different patterns of the volume change following ECT and estimated electric field strength. (A) Fig. 4A shows the mean image of the DBM results. The largest volume expansion was observed in the right medial temporal lobe. The color bar represents percentage volume expansion. (B) Fig. 4B shows the mean image of the estimated electric field. The color bar represents electric field strength (V/m).
