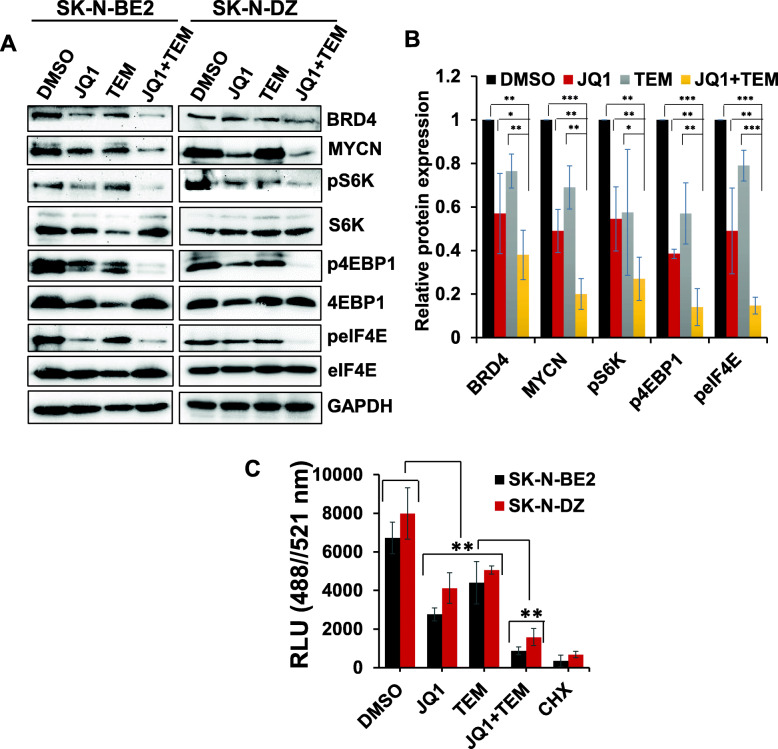
Fig. 3.
Combined effects of JQ1 and TEM on target pathways/molecules and global protein synthesis. (a) Western blot images for the expression of key components of MYCN/mTOR signaling in two MYCN-amplified NB cell lines following treatment with JQ1 (0.5 μM) and TEM (2 μM) alone and combined for 24 h. The original uncropped images of these blots are provided in the Additional File 1 (Fig. S1 and S2). (b) Bar graphs show the quantification of expression of key target proteins (shown in western blot images) relative to the control (DMSO) in the combined blots of SK-N-BE2 and SK-N-DZ cells after GAPDH (loading control) normalization using Image J software. The values represent the mean ± SEM of three replicates of blot. *p < 0.05; **p < 0.01; ***p < 0.001 (Student t test, vehicle/ or single agents vs. combination). (c) Overall protein synthesis measurement by OPP-incorporation following treatment with JQ1 (0.5 μM) and TEM (2 μM) alone or in combination for 24 h. CHX (50 μg/ml, 1 h) was used as a positive control for protein synthesis inhibition. Values represent mean ± SEM. **p < 0.01 (Student-t-test)

