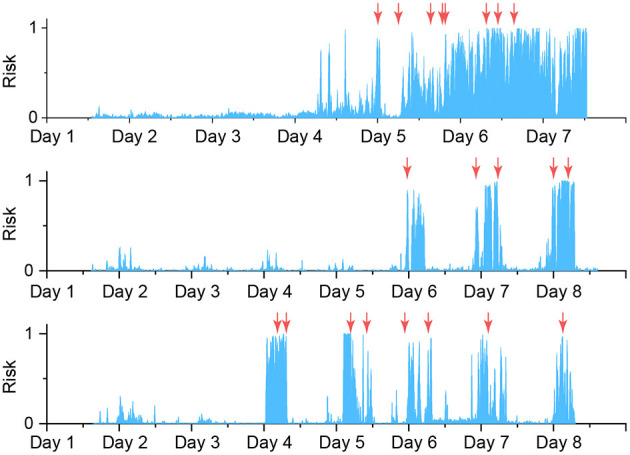
Figure 8.

Risk level of having seizures for top three good performance patients, from top to bottom: Pat-3, Pat-4, Pat-12. All decisions with an uncertainty level higher than 1 are discarded and not shown. Moving average of 50 steps backwards is applied to the probability score (risk level). Orange arrows indicate the seizure onsets.
