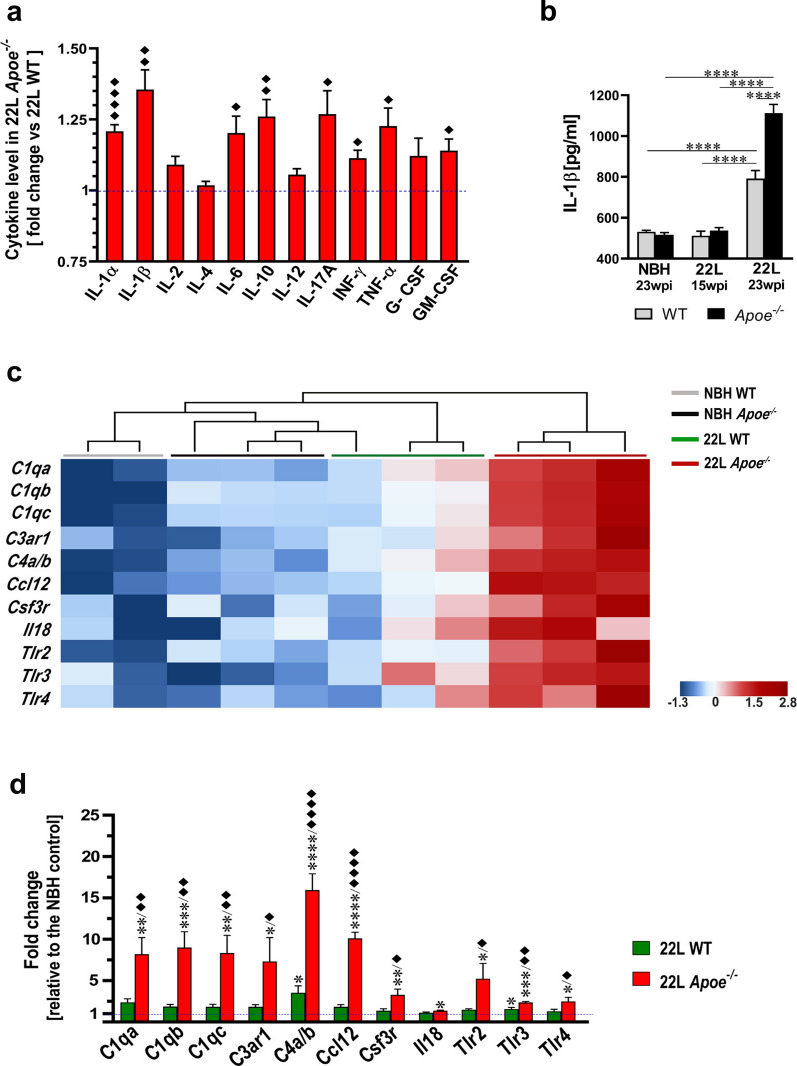
Fig. 10.
Apoe−/− mice show aggravated inflammatory response to prion pathology. a Shown is quantitative analysis of multiple inflammatory cytokines in the brain cortex homogenate comparing 22L Apoe−/− and 22L WT groups at 23 wpi. Values represent fold change in 22L Apoe−/− mice relative to those in 22L WT mice (n = 5–7 mice/ group). b Quantitative analysis of IL-1β concertation in the brain cortex using ELISA in indicated animal groups (n = 5–8 mice/group). c Shown are transcripts heatmaps of nanoStringTM nCounter® expression data for chemokines and cytokine receptor genes from NBH and 22L inoculated WT and Apoe−/− mice at 23 wpi. Clustering analysis shows strong separation of 22L Apoe−/− mice from other groups. d Fold change of nanoStringTM nCounter® values for chemokines and cytokine receptors in 22L WT and 22L Apoe−/− mice (n = 3 mice/group) relative to those in averaged NBH controls (n = 5 mice/group). a *p < 0.05, **p < 0.01, ****p < 0.0001 22L Apoe−/− vs 22L WT (two-tailed t-test with Welch’s correction). b p < 0.0001 (ANOVA); ****p < 0.0001 (Holm’s-Sidak’s post hoc test). d p < 0.05 to p < 0.0001 (ANOVA) analyzed for each gene separately; *p < 0.05, **p < 0.01, ***p < 0.001, and ****p < 0.0001 22L Apoe−/− or 22L WT vs NBH; ♦p < 0.05, ♦♦p < 0.01, and ♦♦♦♦p < 0.001 22L Apoe−/− vs. 22L WT (Holm’s-Sidak’s post hoc test following significant ANOVA). Values in a, b, and d represent group mean + SEM

