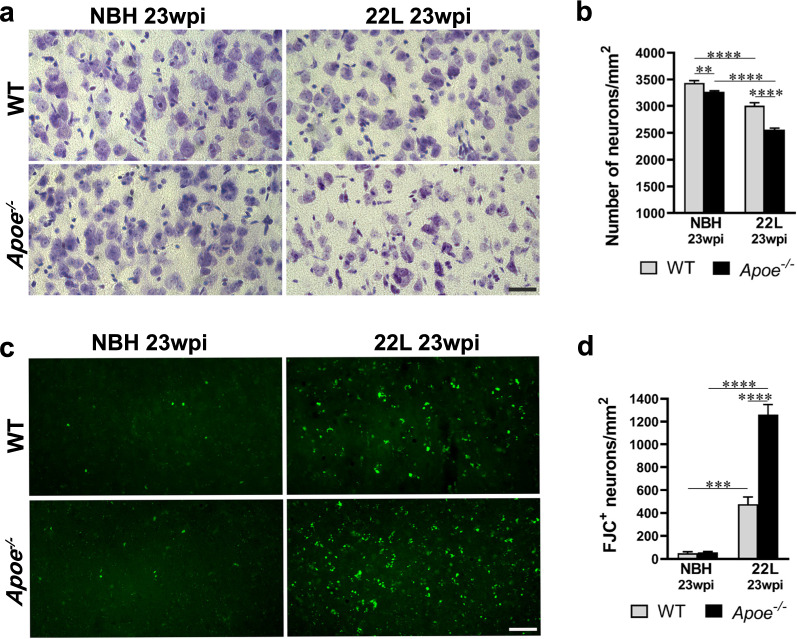
Fig. 11.
Apoe−/− mice show aggravated neuronal loss and degeneration during prion infection. a and c Representative microphotographs of S1 cortex layer V neurons stained with cresyl violet and FJC from indicated animal groups, respectively. b and d Analysis of numerical density of cresyl violet and FJC stained neurons in the same area (n = 10–11 mice/group in b and n = 6–8 mice/group in d). 22L Apoe−/− mice show greater neuronal loss and higher number of degenerating (FJC+) neurons compared to 22L WT mice. b and d p < 0.0001 (ANOVA); **p < 0.01, ***p < 0.001, and ****p < 0.0001 (Holm’s-Sidak’s post hoc test). Values in b and d represent mean + SEM. Scale bar: 30 μm in a and c

