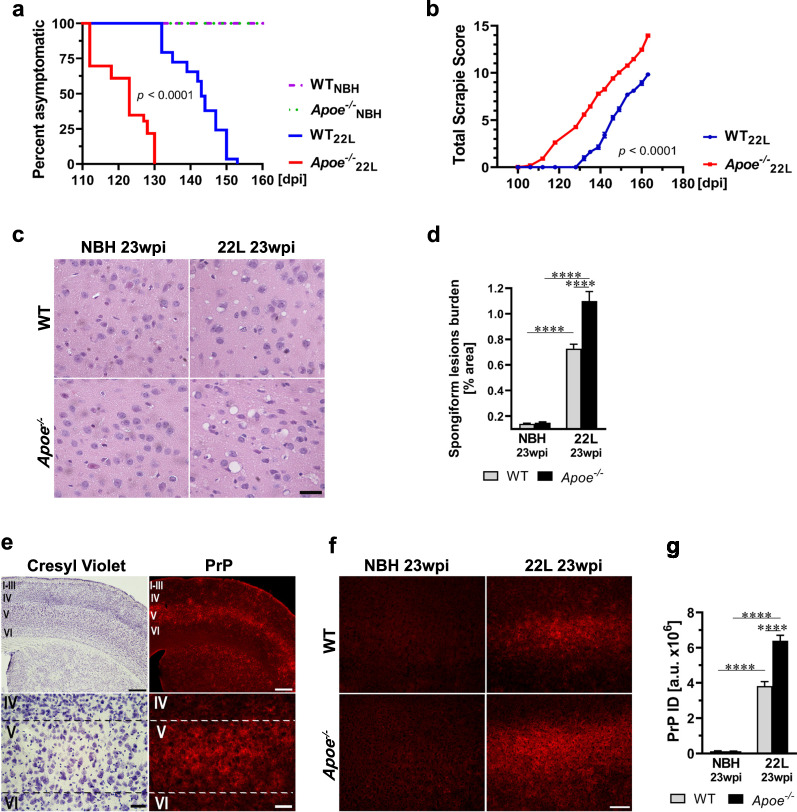
Fig. 2.
Apoe−/− mice have shorter incubation time and exaggerated prion pathology. a Kaplan–Meier estimator of the incubation time in 22L and NBH inoculated WT and Apoe−/− mice. The x-axis denotes days post inoculation (dpi) while the y-axis a percent of animals, which remain asymptomatic from the initial count of 29 22L inoculated WT mice, 23 22L inoculated Apoe−/− mice and 22–23 NBH inoculated WT and Apoe−/− mice each. b Shown is the Total Scrapie Score longitudinally assessed in 22L inoculated WT and Apoe−/− mice from 12 wpi. Values represent mean ± SEM from 11 to 12 mice per group. c Representative microphotographs of the M1 motor cortex (Bregma + 1.5 mm) stained with hematoxylin and eosin to show differences in the load of spongiform pathology. d Quantification of the spongiform lesion burden in the M1 cortex representing mean values + SEM from 6 to 7 mice per group. e Microphotographs of the S1 somatosensory cortex (Bregma + 0.0 mm) in 22L WT mice (23 wpi) stained with cresyl violet for cytoarchitectonic orientation or immunostained against PrP to assess distribution of PrP deposition, which shows preponderance for accumulation in the layer V. f Representative microphotographs of anti-PrP immunostaining in the S1 cortex in various animal groups and g Integrated density (ID) quantification of the anti-PrP signal in the S1 cortex. Shown are means + SEM from 5 to 7 mice per group. a p < 0.0001 denotes the significance between 22L Apoe−/− and WT groups. Differences between 22L Apoe−/− and NBH Apoe−/− and between 22L WT and NBH WT groups are not shown in the graph but they also are significant at p < 0.0001 (Log-Rank test). The difference between NBH WT and NBH Apoe−/− is not statistically significant. b p < 0.0001 (2-way ANOVA). d, g p < 0.0001 (ANOVA); ****p < 0.0001 (Holm’s-Sidak’s post hoc test). Scale bars: 30 μm in c, 350 μm (upper panel) and 40 μm (lower panel) in e, and 100 μm in f

