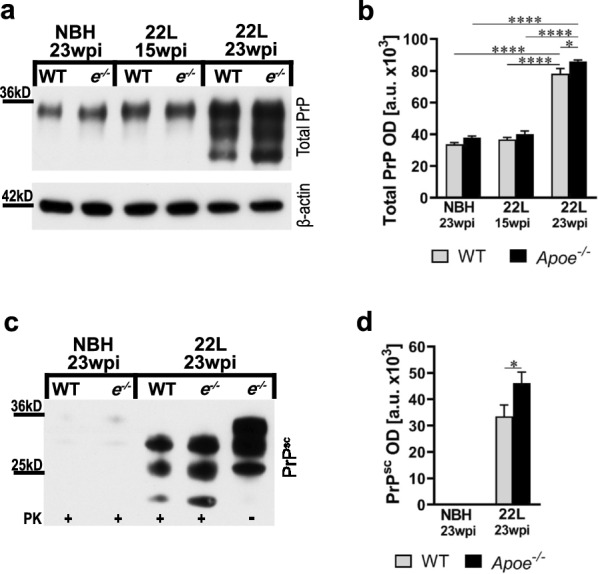
Fig. 3.

Apoe−/− mice accumulate more PrPSc. a and c Immunoblot analysis of the total PrP protein and that of proteinase K (PK) resistant PrPSc in the brain cortex in B6 WT and Apoe−/− (e−/−) lines, respectively. Also included are β-actin as the loading control in a and PK digestion control (last lane) in c. b and d Densitometric quantification of total PrP and PrPSc protein band optical densities (OD). Values represent mean + SEM from 8 to 10 mice per group. b p < 0.0001 (ANOVA); *p < 0.05, and ****p < 0.0001 (Holm’s-Sidak’s post hoc test). d *p < 0.05 (two-tailed t-test with Welch’s correction)
