Fig. 4.
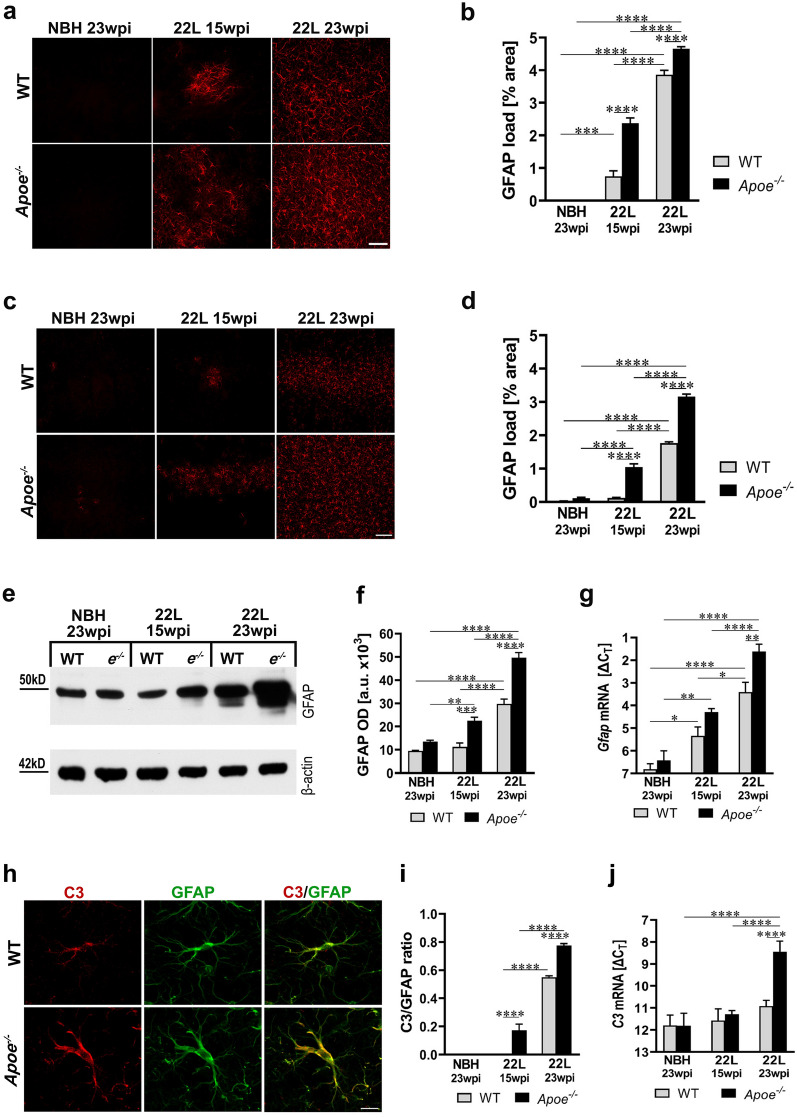
Aggravation of astrogliosis in prion infected Apoe−/− mice. a and c Shown are representative microphotographs of coronal cross-sections through the VPN thalamic nucleus and the S1 primary somatosensory cortex immunostained against GFAP from indicated animal groups, respectively. b and d Quantitative analysis of GFAP+ load in the VPN and the S1 cortex, respectively (n = 8–12 mice/group). e Immunoblot analysis of GFAP protein level in the brain cortex with β-actin as the loading control and f densitometric quantification of GFAP protein band optical densities (OD) (n = 7–12 mice/group). g Analysis of Gfap mRNA level. The qRT-PCR results are presented as the ΔCT values (n = 3–11 mice/group). In Apoe−/− mice astrogliosis appears earlier in the course of prion pathology and it is more pronounced than in WT mice. h Representative LSCM images of C3/GFAP double immunostained astrocytes in 22L WT and 22L Apoe−/− mice at 23 wpi. i Quantitative analysis of C3/GFAP ratio in the S1 cortex (n = 8–11 mice/group). j Analysis of C3 mRNA level. The qRT-PCR results represent the ΔCT values (n = 3–11 mice/group). There is a marked upregulation of C3 expression during prion infection, which is significantly greater in Apoe−/− mice. b, d, f, g, i, and j p < 0.0001 (ANOVA); *p < 0.05. **p < 0.01, ***p < 0.001, and ****p < 0.0001 (Holm’s-Sidak’s post hoc test). All numerical values represent mean + SEM. Scale bars: 50 μm in a, 100 μm in c, and 10 μm in h

