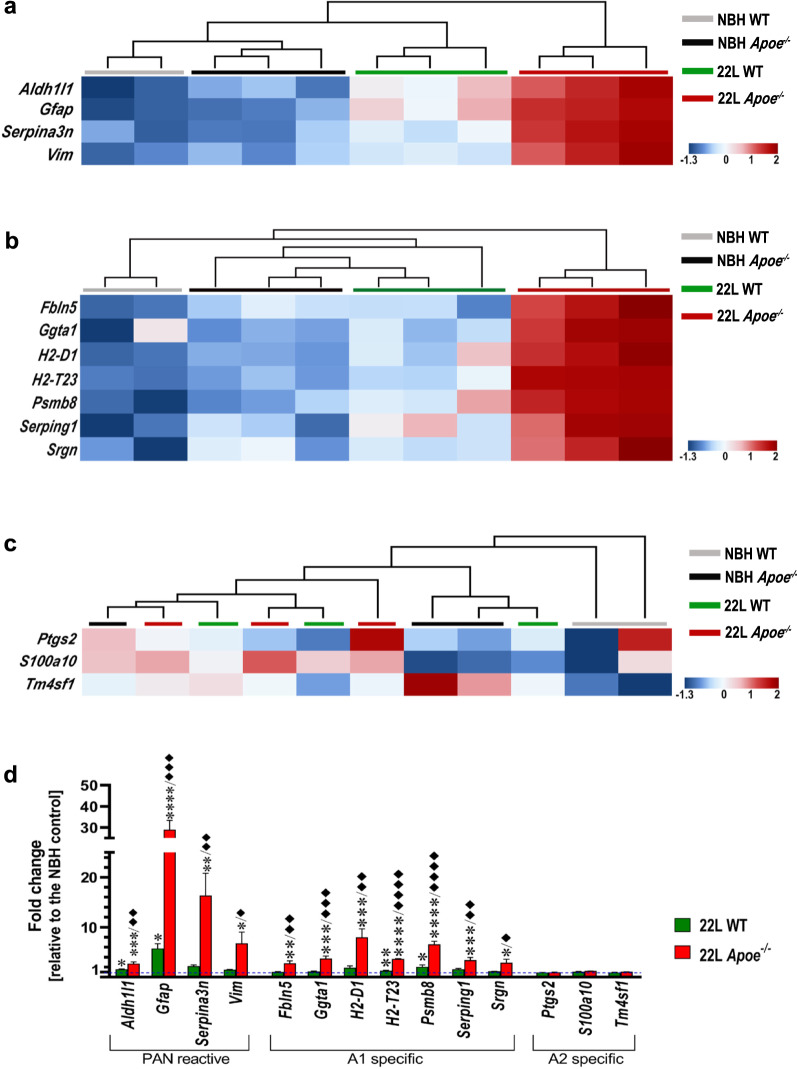
Fig. 5.
Analysis of astrocytic activation marker expression demonstrates aggravation of A1 astrocyte phenotype in prion infected Apoe−/− mice. Shown are transcript heatmaps of nanoStringTM nCounter® expression data from NBH and 22L inoculated WT and Apoe−/− mice, which were killed at 23 wpi. Reactive astrocyte specific transcripts are split into a PAN–specific, b A1–specific, and c A2 -specific cassettes. Hierarchical cluster analysis shows strong separation of 22L Apoe−/− mice from other experimental groups both for PAN- and A1- specific cassettes. The 22L WT mouse cluster separates from NBH inoculated WT and Apoe−/− mice within the PAN-reactive cassette but not within A1- specific cassette. No clustering within experimental groups is seen for A2 -specific cassette markers. d Fold change of nanoStringTM nCounter® values for PAN- A1-, and A2-reactive astrocyte markers in 22L WT and 22L Apoe−/− mice (n = 3 mice/group) relative to those in averaged NBH controls (n = 5 mice/group) at 23 wpi. d p < 0.01 to p < 0.0001 (ANOVA) analyzed separately for each gene from the PAN–and A1-reactive cassettes; *p < 0.05 **p < 0.01 ***p < 0.001, and ****p < 0.0001 22L Apoe−/− or 22L WT vs averaged NBH controls; ♦p < 0.05, ♦♦p < 0.01, ♦♦♦p < 0.001, and ♦♦♦♦p < 0.0001 22L Apoe−/− vs 22L WT (Holm’s-Sidak’s post hoc test following significant ANOVA). ANOVA for any of A2-specific cassette gene was not significant. All numerical values represent mean + SEM

