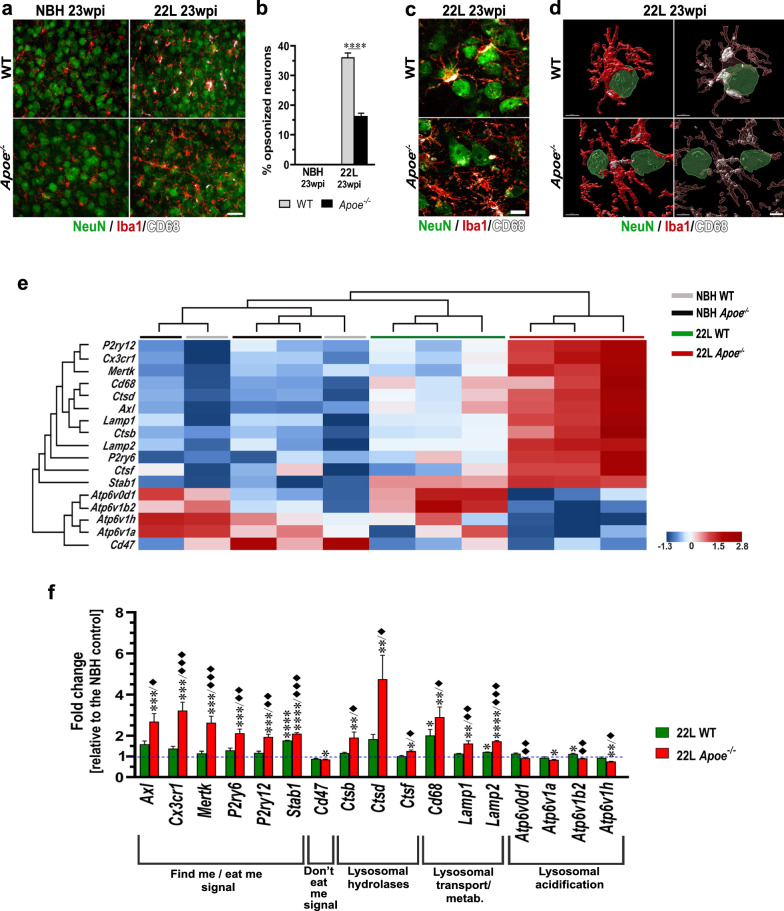
Fig. 9.
Impairment of microglia neuronophagy in prion infected Apoe−/− mice. a Representative epifluorescent microphotographs of the S1 somatosensory cortex triple immunostained against NeuN neuronal marker and CD68 and Iba1 microglia markers in mice from indicated experimental groups at 23 wpi. b Enumeration of neurons opsonized by CD68+/Iba1+ microglia in the layer V of the S1 cortex (n = 6–7 mice/group). There is apparent reduction in the number of neurons coming in close contact with CD68+/Iba1+ microglia in 22L Apoe−/− mice compared to 22L WT mice. c Representative LSCM images of NeuN/Iba1/CD68 triple immunostained sections and d 3-D reconstructions of LCSM stacks detailing neuronal opsonization by phagocytically activated (CD68+) microglia. In the right panel intracellular CD68 staining (white) is visualized by rendering Iba1 mask transparent. 3-D reconstructions of LCSM stacks details close enveloping of NeuN+ neurons by CD68+/Iba1+ microglia in in 22L WT mice and evidence for reduction in close neuronal/microglia contacts in 22L Apoe−/− mice. e Shown are transcripts heatmaps of nanoStringTM nCounter® expression data for efferocytosis and endosomal/lysosomal pathways related genes in NBH and 22L inoculated WT and Apoe−/− mice at 23 wpi. Individual 22L inoculated WT and Apoe−/− mice but not NBH inoculated controls, cluster at group level. Clustering analysis shows clear separation of 22L Apoe−/− animals from other groups. f Fold change of nanoStringTM nCounter® values for efferocytosis and phagocytosis markers in 22L WT and 22L Apoe−/− mice (n = 3 mice/group) relative to those in averaged NBH controls (n = 5 mice/group). b ****p < 0.0001 (two-tailed t-test with Welch’s correction). f p < 0.05 to p < 0.0001 (ANOVA) analyzed for each gene separately; *p < 0.05 **p < 0.01 ***p < 0.001, and ****p < 0.0001 22L Apoe−/− or 22L WT vs. NBH; ♦p < 0.05, ♦♦p < 0.01, and ♦♦♦p < 0.001 22L Apoe−/− vs. 22L WT (Holm’s-Sidak’s post hoc test following significant ANOVA). Data in b and f represent mean + SEM. Scale bars: 30 μm in a, 10 μm in c, and 5 μm in d

