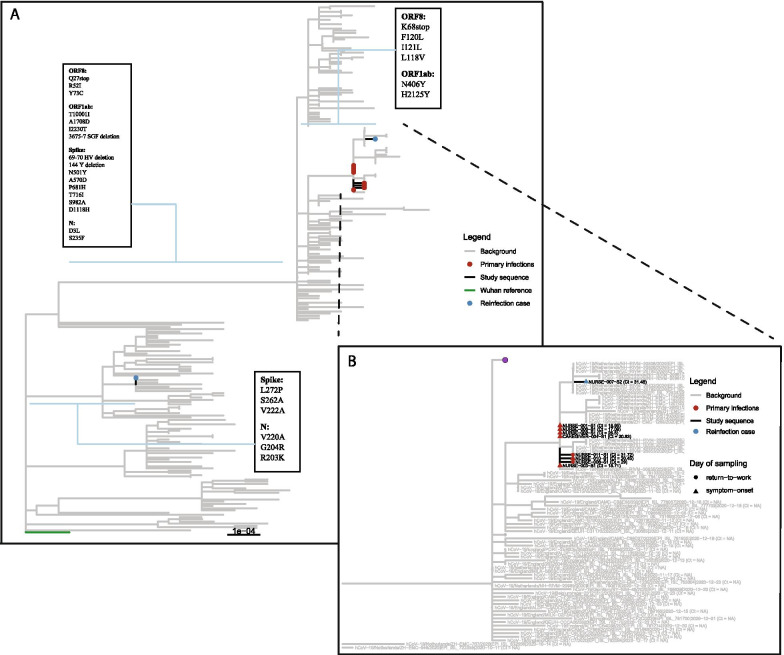
Fig. 2.
a Maximum-likelihood tree depicting sequenced samples and amino-acid differences between reinfection sequences. Red indicates outbreak samples. Blue circles reflect sequences derived from reinfection case. Boxes indicate the amino-acid changes relative to the Wuhan-1 reference genome along the indicated branches. Contemporaneous background sequences were derived from GISAID and are depicted as grey branches. b B.1.1.7 clade of a with focus on outbreak sequences. Red indicates outbreak samples. Purple dots represents a collection of collapsed branches of background sequences. When samples were unavailable at day-of-detection, samples collected at day of return-to-work were used where available. Contemporaneous background sequences were derived from GISAID and are depicted as grey branches

