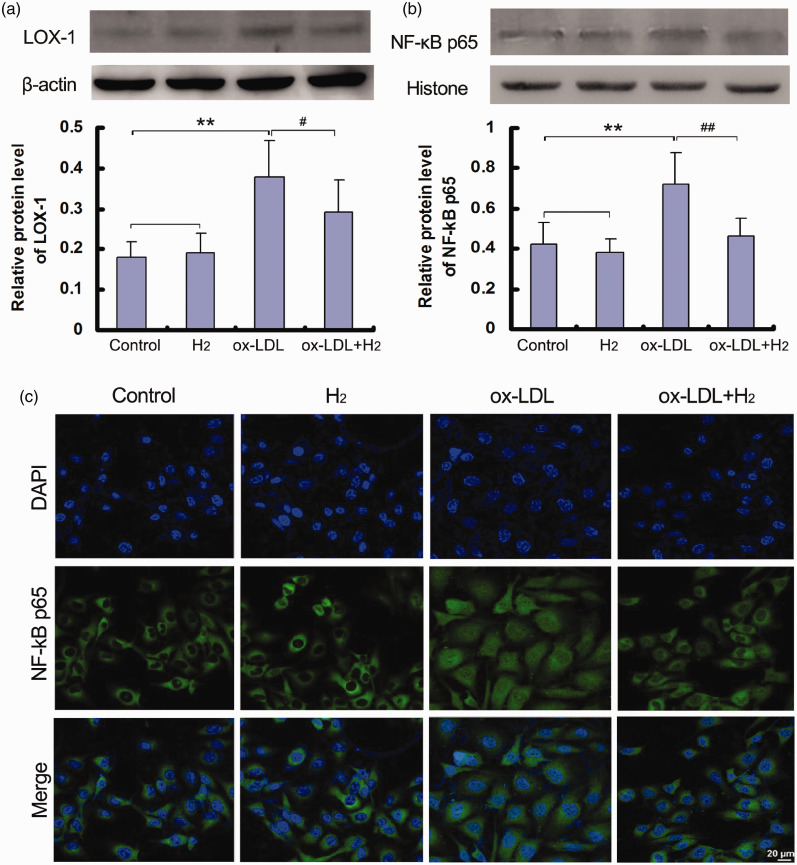
Figure 3.
Hydrogen down-regulated LOX-1/NF-κB signaling pathway in ox-LDL-induced HUVECs. The protein expressions of LOX-1 in cells and NF-κB p65 in nucleus were analyzed by Western blot or immunofluorescence. (a) LOX-1 protein level in cells by Western blot; (b) NF-κB p65 protein level in nucleus by Western blot; (c) visualized NF-κB p65 in nucleus by immunofluorescence experiment. Data were presented as mean ± SD of at least three independent experiments. **P < 0.01 vs. control group; #P < 0.05, ##P < 0.01 vs. ox-LDL group. (A color version of this figure is available in the online journal.)

