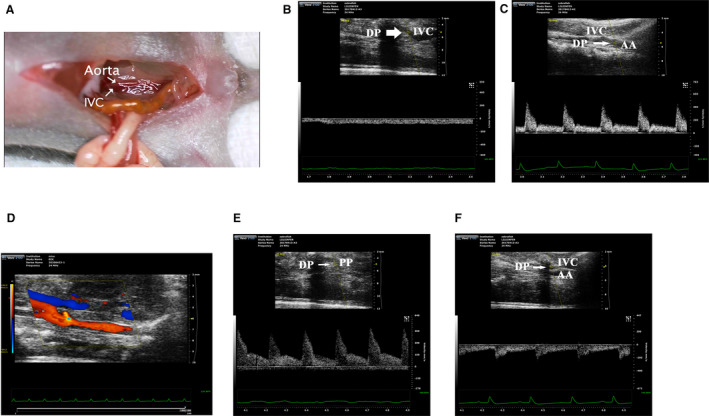
Figure 1. Establishment of the abdominal aorta and inferior vena cava fistula.

A, Schematic diagram of abdominal aorta and inferior vena cava fistula model. B, Under normal circumstances, the inferior vena cava has no pulsatile blood flow, and the detection point is located in the inferior vena cava. C, Under normal circumstances, there are pulsatile blood flow in abdominal aorta, with a peak blood flow velocity of 400 mm/s. D, The representative image of blood flow through the puncture point. E, The representative image of pulsating blood flow at the puncture point, with a peak blood flow velocity of 450 mm/s, which is higher than that of normal aortic blood flow. F, After puncture, the pulsatile blood flow appeared in the inferior vena cava, with a peak blood flow velocity of 200 mm/s. AA indicates abdominal aorta; DP, detection point; IVC, inferior vena cava; and PP, puncture point.
