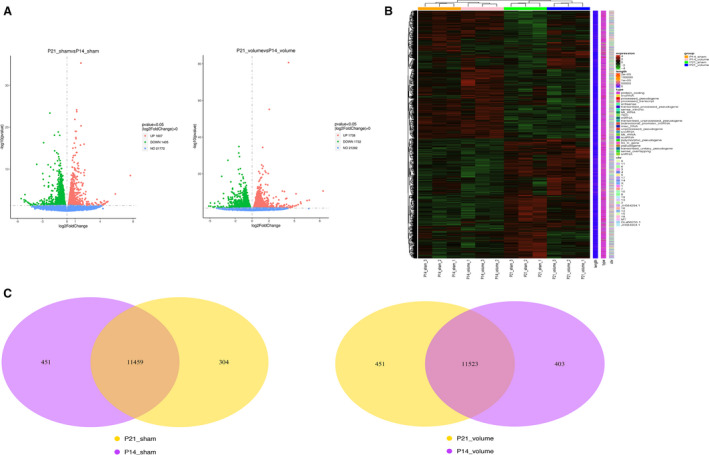
Figure 3. The transcriptomic changes of postnatal right ventricular development.

A, Volcano map of differentially expressed genes of postnatal right ventricular development in the normal condition (postnatal day 21 sham vs postnatal day 14 sham) and under the influence of volume overload (postnatal day 21 volume overload and postnatal day 14 volume overload). B, Cluster analysis of differentially expressed genes. Every group had 3 mice. The redder the color, the higher the expression level; the bluer, the lower. The clusters of genes in each group are quite different from each other but similar in the same group. C, Venn diagram of differentially expressed genes. P14 indicates postnatal day 14; and P21, postnatal day 21.
