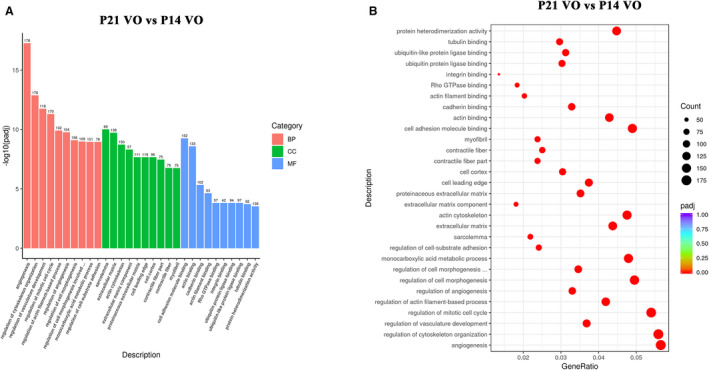
Figure 5. The processes of postnatal right ventricular development partially switched to angiogenesis and cell cycle regulation, as indicated by gene ontology (GO) analysis.

A, From the results of the GO enrichment analysis, the most significant 10 terms are displayed. The abscissa is the GO term, and the ordinate is the significance level of the GO term enrichment. The higher the value, the more significant the result, and the different colors represent 3 different GO subclasses: biological process, cellular component, and molecular function. B, From the results of the GO enrichment analysis, the most significant 30 terms were selected to draw scatter plots for display. The abscissa is the ratio of the number of differentially expressed genes on the GO term to the total number of differentially expressed genes, the ordinate is GO term, the size of the dots represent the number of genes annotated to the GO term, and the colors from red to purple represent the significance level of the GO term enrichment. P14 indicates postnatal day 14; BP, biological process; CC, cellular component; MF, molecular function; and P21, postnatal day 2.
