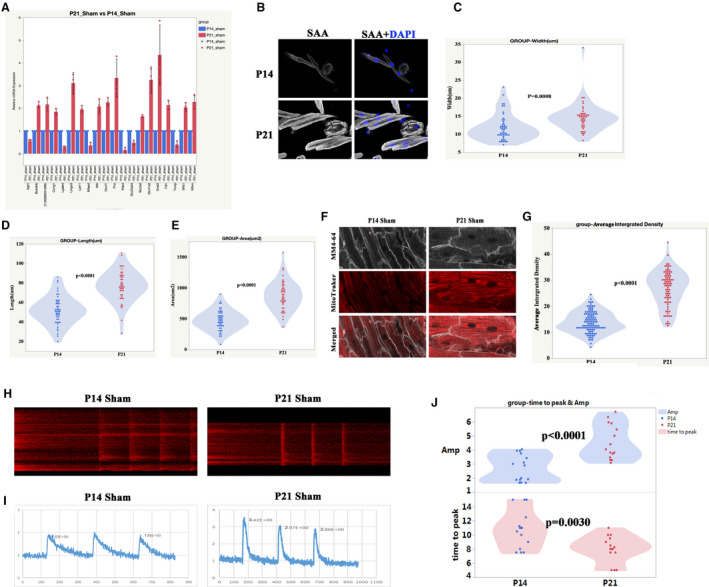
Figure 7. The processes of normal postnatal right ventricular (RV) development are primarily associated with metabolic and cardiac muscle maturation.

A, The top 20‐fold change genes between postnatal day 21 (P21) sham and postnatal day 14 (P14) sham were selected for verification by quantitative real‐time polymerase chain reaction. P<0.05, n=3 mice, Mann‐Whitney test. B, Representative isolated cardiomyocytes from P14 and P21 RV. Sarcomeric α‐actinin (SAA, white), 4',6‐diamidino‐2‐phenylindole (blue). C, Quantification of cell width from P14 and P21 RV, Student t test. D, Quantification of cell length from P14 and P21 RV. E, Quantification of cell area from P14 and P21 RV. F, Representative of T‐tubule and mitochondria from P14 and P21 RV. MM4‐64 (T‐tubule, white), mitochondria (red). G, Quantification of mitochondria intensity from P14 and P21 RV, Student t‐test. H, Representative of the calcium transient image of cardiomyocytes from P14 and P21 RV, Student t test. I, Plot representative of the calcium transient image of cardiomyocytes from P14 and P21 RV. J, Quantification of the calcium transient parameters (amplitude (Amp) and time to peak), Student t‐test. P14, postnatal day 14; and P21, postnatal day 2.
