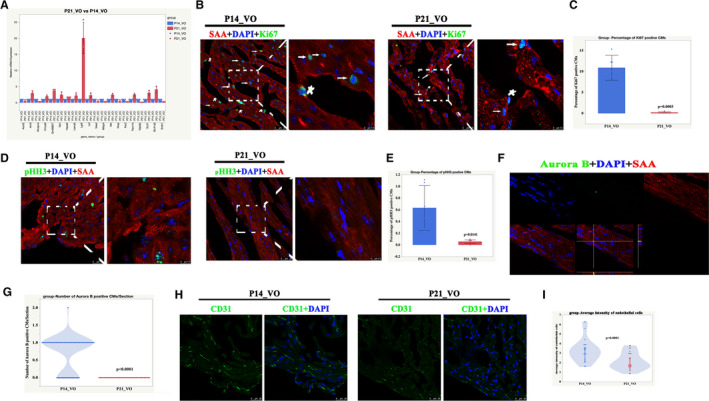
Figure 8. The processes of postnatal right ventricular development partially switched to cell cycle regulation and angiogenesis.

A, The top 20‐fold change genes between postnatal day 21 volume overload and postnatal day 14 volume overload were selected for verification by quantitative real‐time polymerase chain reaction. P<0.05, n=3 mice, Mann‐Whitney test. B, Representative Ki67‐positive cardiomyocytes. Sarcomeric α‐actinin (red), 4',6‐diamidino‐2‐phenylindole (blue), Ki67 (green). Star indicates Ki67‐positive non‐cardiomyocytes; arrow indicates Ki67‐positive cardiomyocytes. C, Quantification of Ki67‐positive cardiomyocytes, n=6 mice, Student t‐test. D, Representative pHH3 (phospho‐histone H3)‐positive cardiomyocytes from postnatal day 14 volume overload and postnatal day 21 volume overload. Sarcomeric α‐actinin (red), 4',6‐diamidino‐2‐phenylindole (blue), pHH3 (green). E, Quantification of pHH3‐positive cardiomyocytes, n=6 mice, Student t‐test. F, Representative aurora B‐positive cardiomyocytes from postnatal day 14 volume overload and postnatal day 21 volume overload . Sarcomeric α‐actinin (red), diamidino‐2‐phenylindole (blue), aurora B (green). G, Quantification of aurora B‐positive cardiomyocytes, n=60 sections from 6 mice, Student t‐test. H, Representative CD31‐positive cells. I, Quantification of CD31‐positive cells, n=30 sections from 6 mice, Student t‐test. DAPI indicates diamidino‐2‐phenylindole; P14, postnatal day 14; P21, postnatal day 2; SAA, sarcomeric α‐actinin; and VO, volume overload.
