
Figure 4.
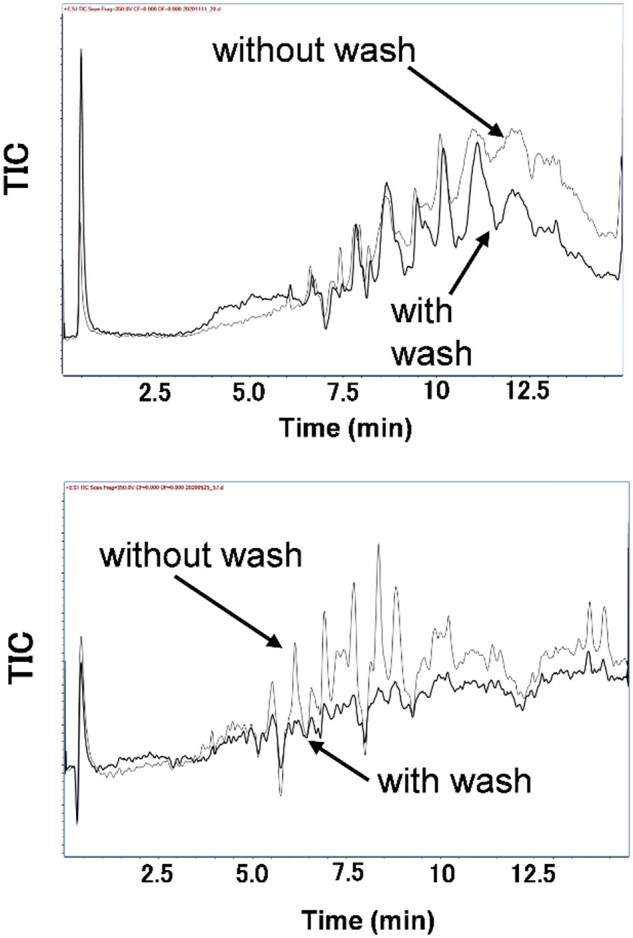
Total ion chromatogram (TIC) (m/z 500–1500) of a red snapper sample solution prepared according to Figure 2 with or without sodium carbonate washing (top) and also with or without citric acid washing (bottom). Each bold line represents the TIC with washing.