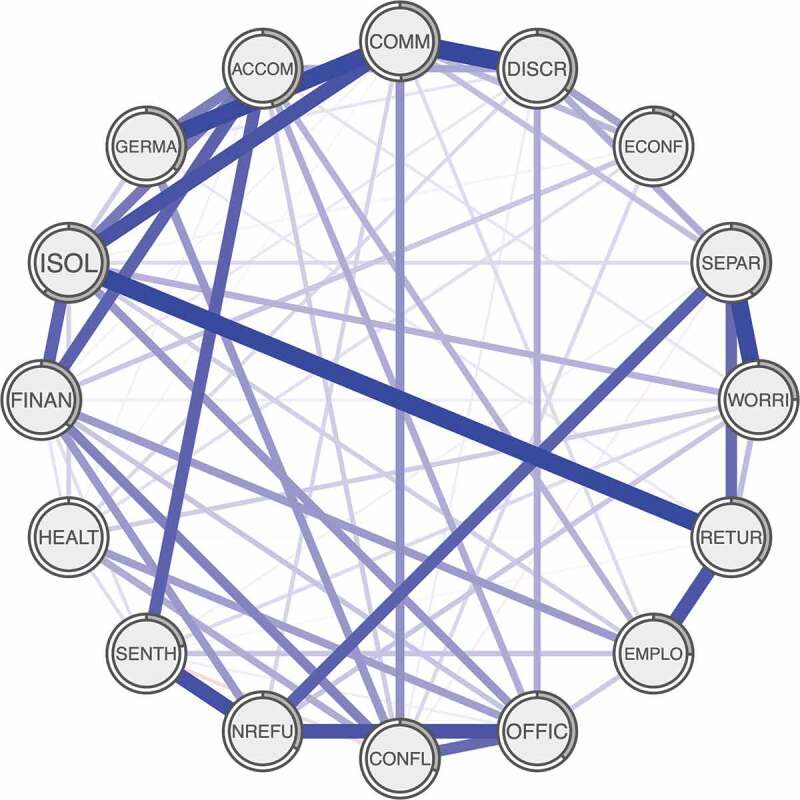
Figure 1.

The estimated network of 16 postmigration living difficulties
Each postmigration living difficulty is represented by a node. Edges represent partial correlations between the postmigration living difficulties. In the rings, the grey area represents predictability, with a full ring indicating R2 of 1. A cut value of 0 was used for the visualization.
