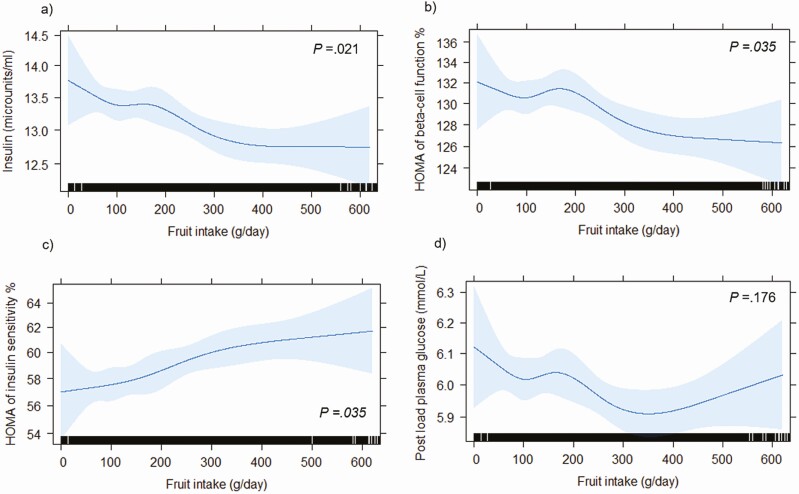
Figure 2.
Graphical representation of the multivariable-adjusted dose-response relationship between total fruit intake and baseline A, fasting serum insulin; B, the updated homeostasis model assessment (HOMA2) of β-cell function; C, HOMA2 of insulin sensitivity, and D, 2-hour postload plasma glucose, obtained by generalized regression models with the exposure included as a restricted cubic spline (n = 7675). The HOMA2 computer model was used to estimate the HOMA of insulin sensitivity and HOMA of β-cell function. Blue shading represents 95% CI. The rug plot along the bottom of each graph depicts each observation. All analyses were adjusted for age, sex, physical activity levels, level of education, Socio-Economic Indexes for Areas, income, body mass index, smoking status, prevalence of cardiovascular disease, parental history of diabetes, and intakes of vegetables, alcohol, red meat, processed meat, and energy. P values for the effect of the exposure on the response (false discovery rate corrected) were obtained using likelihood ratio tests.

